

Often, on marketing discovery calls, we get some version of, “Okay, but how do you do that?!!”
Fair question.
So in the name of science, we’re opening the working log behind our 2026 tourism advertising season! Combined with statistical review of performance, we’ve put together quite the extensive peek behind the curtain, letting readers in on our most recent summer.

Think of the log as the place that captures the decisions behind the numbers, from redirecting promotion away from sold-out departures to checking with reservations about phone leads. It’s nothing we’ve seen any agency share before.
So who’s ready for some tea? Let’s crack into what those campaigns and conversations showed us!
Client identities are anonymized. Findings combine aggregated results with selected campaign examples.
The 2026 tourism ad season by the numbers
At Von Mack, we’re known for our creative approach to integrated strategy. Lots of things happen at once, and they work together to compound into sustainable sales growth.
This study zooms in on one part of that big picture: paid campaigns. In practice, they run inside a collaborative, full-service strategy we plan and evolve together with each client, so the results here reflect the whole system at work, not just ads alone.
For our clients who do partner with us on campaigns, sometimes campaigns run in controlled supportive spurts in tandem with things like billboards, transit ads, and more. Generally, though, we work on a month-to-month basis. This study focuses on the ongoing, monthly campaigns for our experience-based clients alone. Clients in this summer study are based across the United States, with tours, activities, and trips in destinations around the world. Their campaigns reach domestic and international audiences according to each business’s markets.
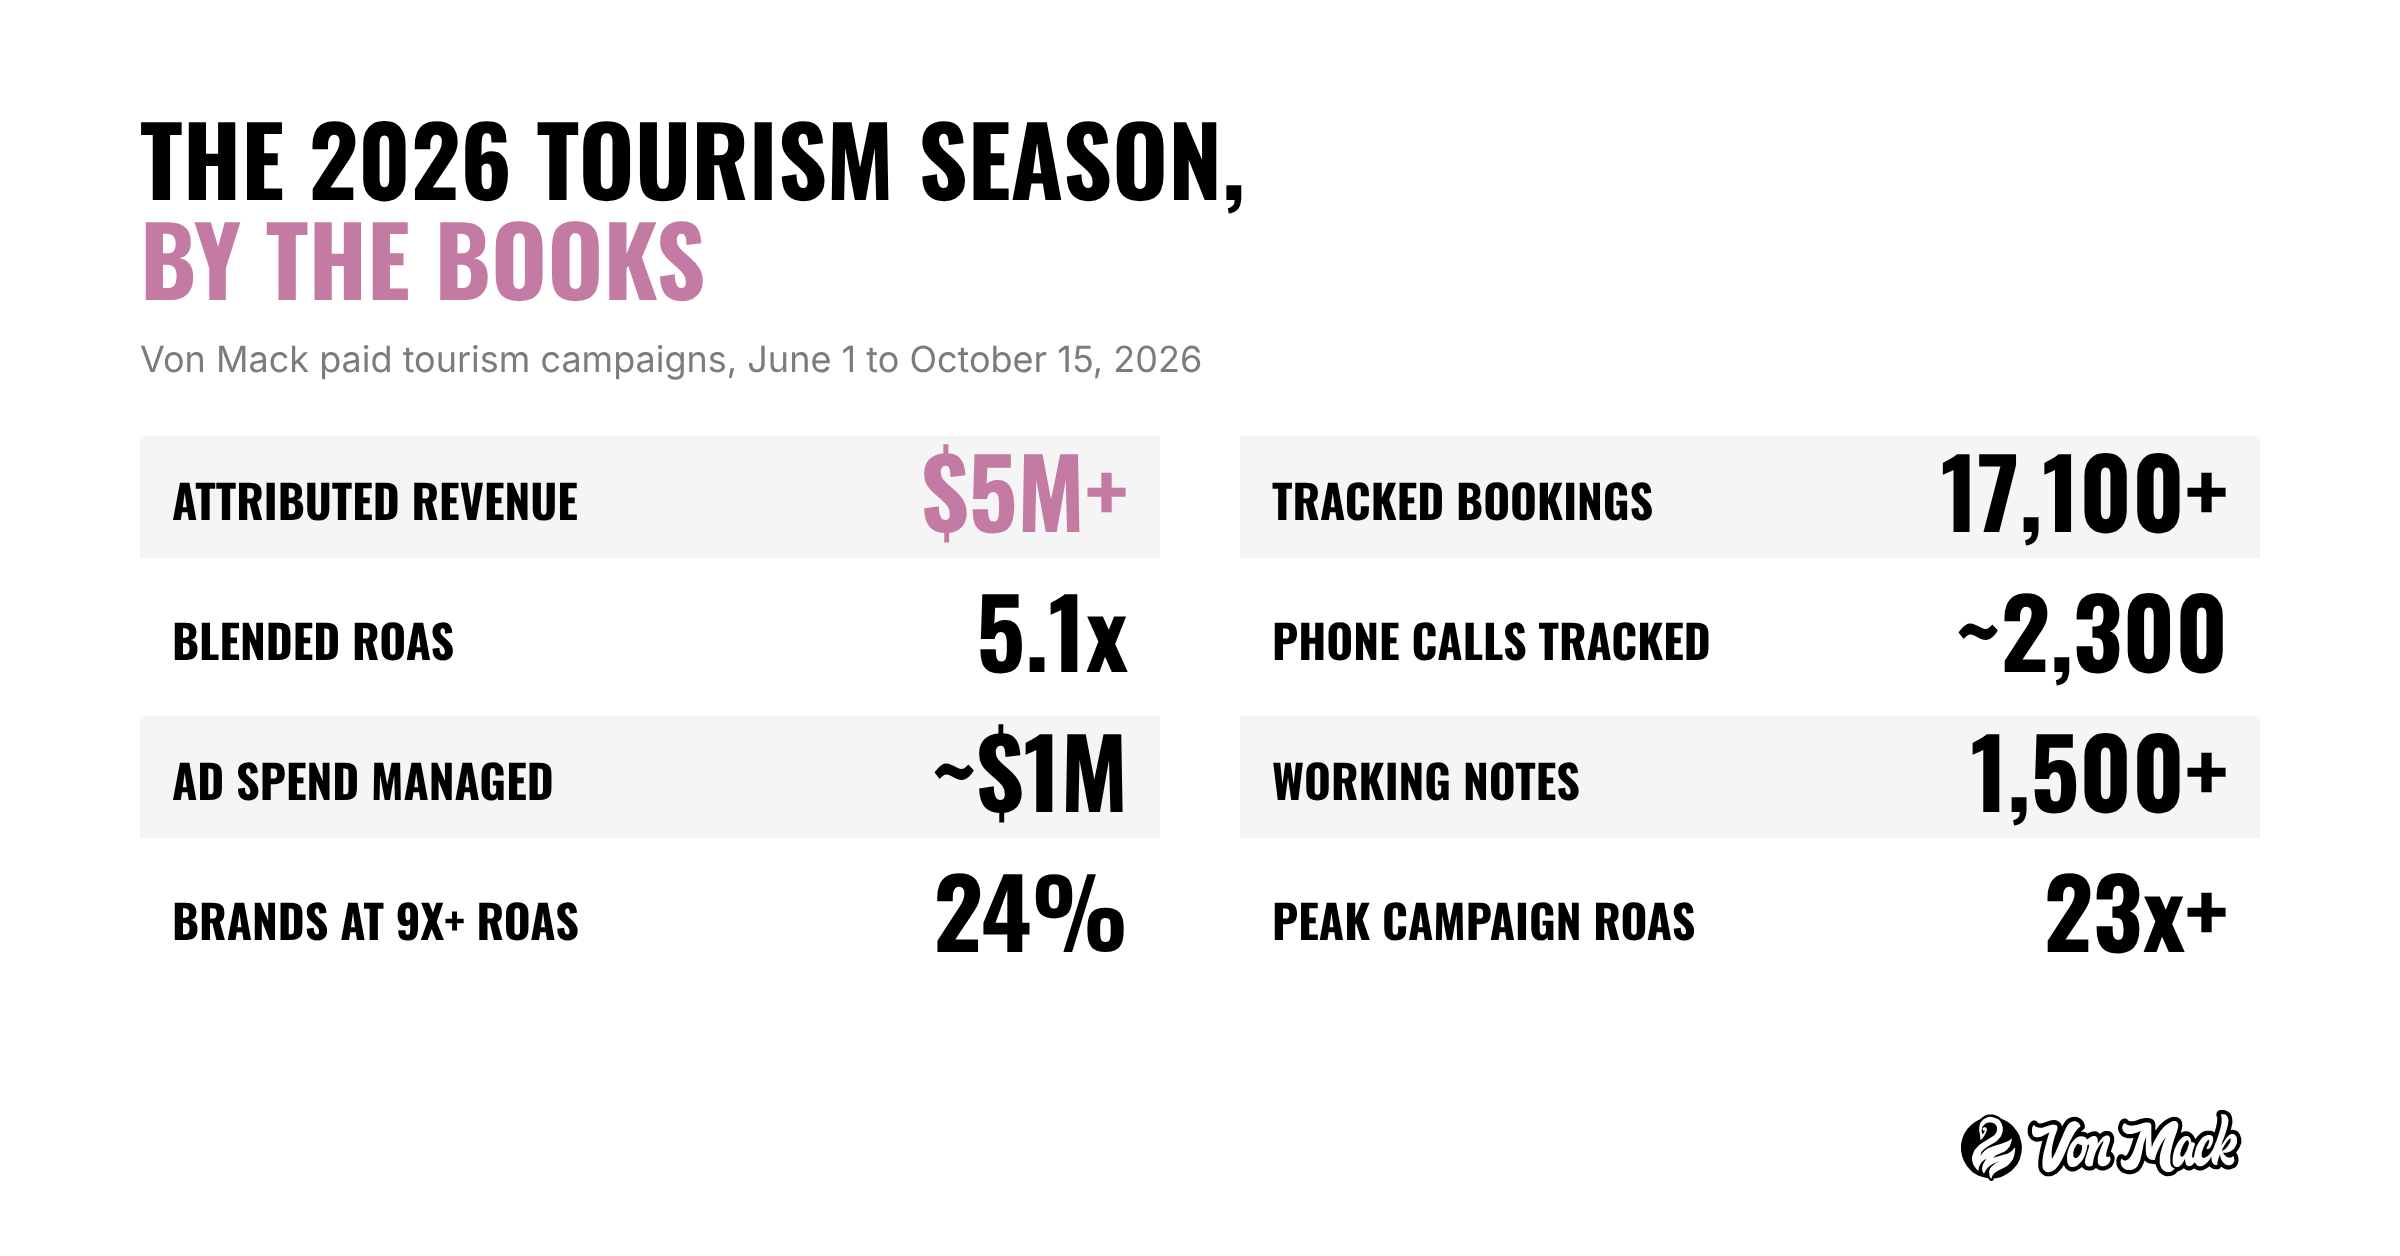
The season’s reported totals included more than $5 million in platform-attributed revenue, a 5.1x total blended return on ad spend, and more than 17,100 tracked bookings. Nearly a quarter of revenue-tracked brands returned 9x or more. Google Ads also recorded approximately 2,300 phone calls during this period.
One more thing before we dig in: this is a study of the full breadth of our campaigns.
The good, the bad, and the ugly are all in here, because the goal is an honest baseline our peers can learn from.
It’s explicitly not a highlight reel of our peaks. For those, our standout case studies live in our portfolio and on our digital marketing page. (And yes, we were national finalists for Best PPC Campaign and Best Use of Search – Travel / Leisure at the US Search Awards this year!)
1) How did advertising performance vary across tourism businesses?
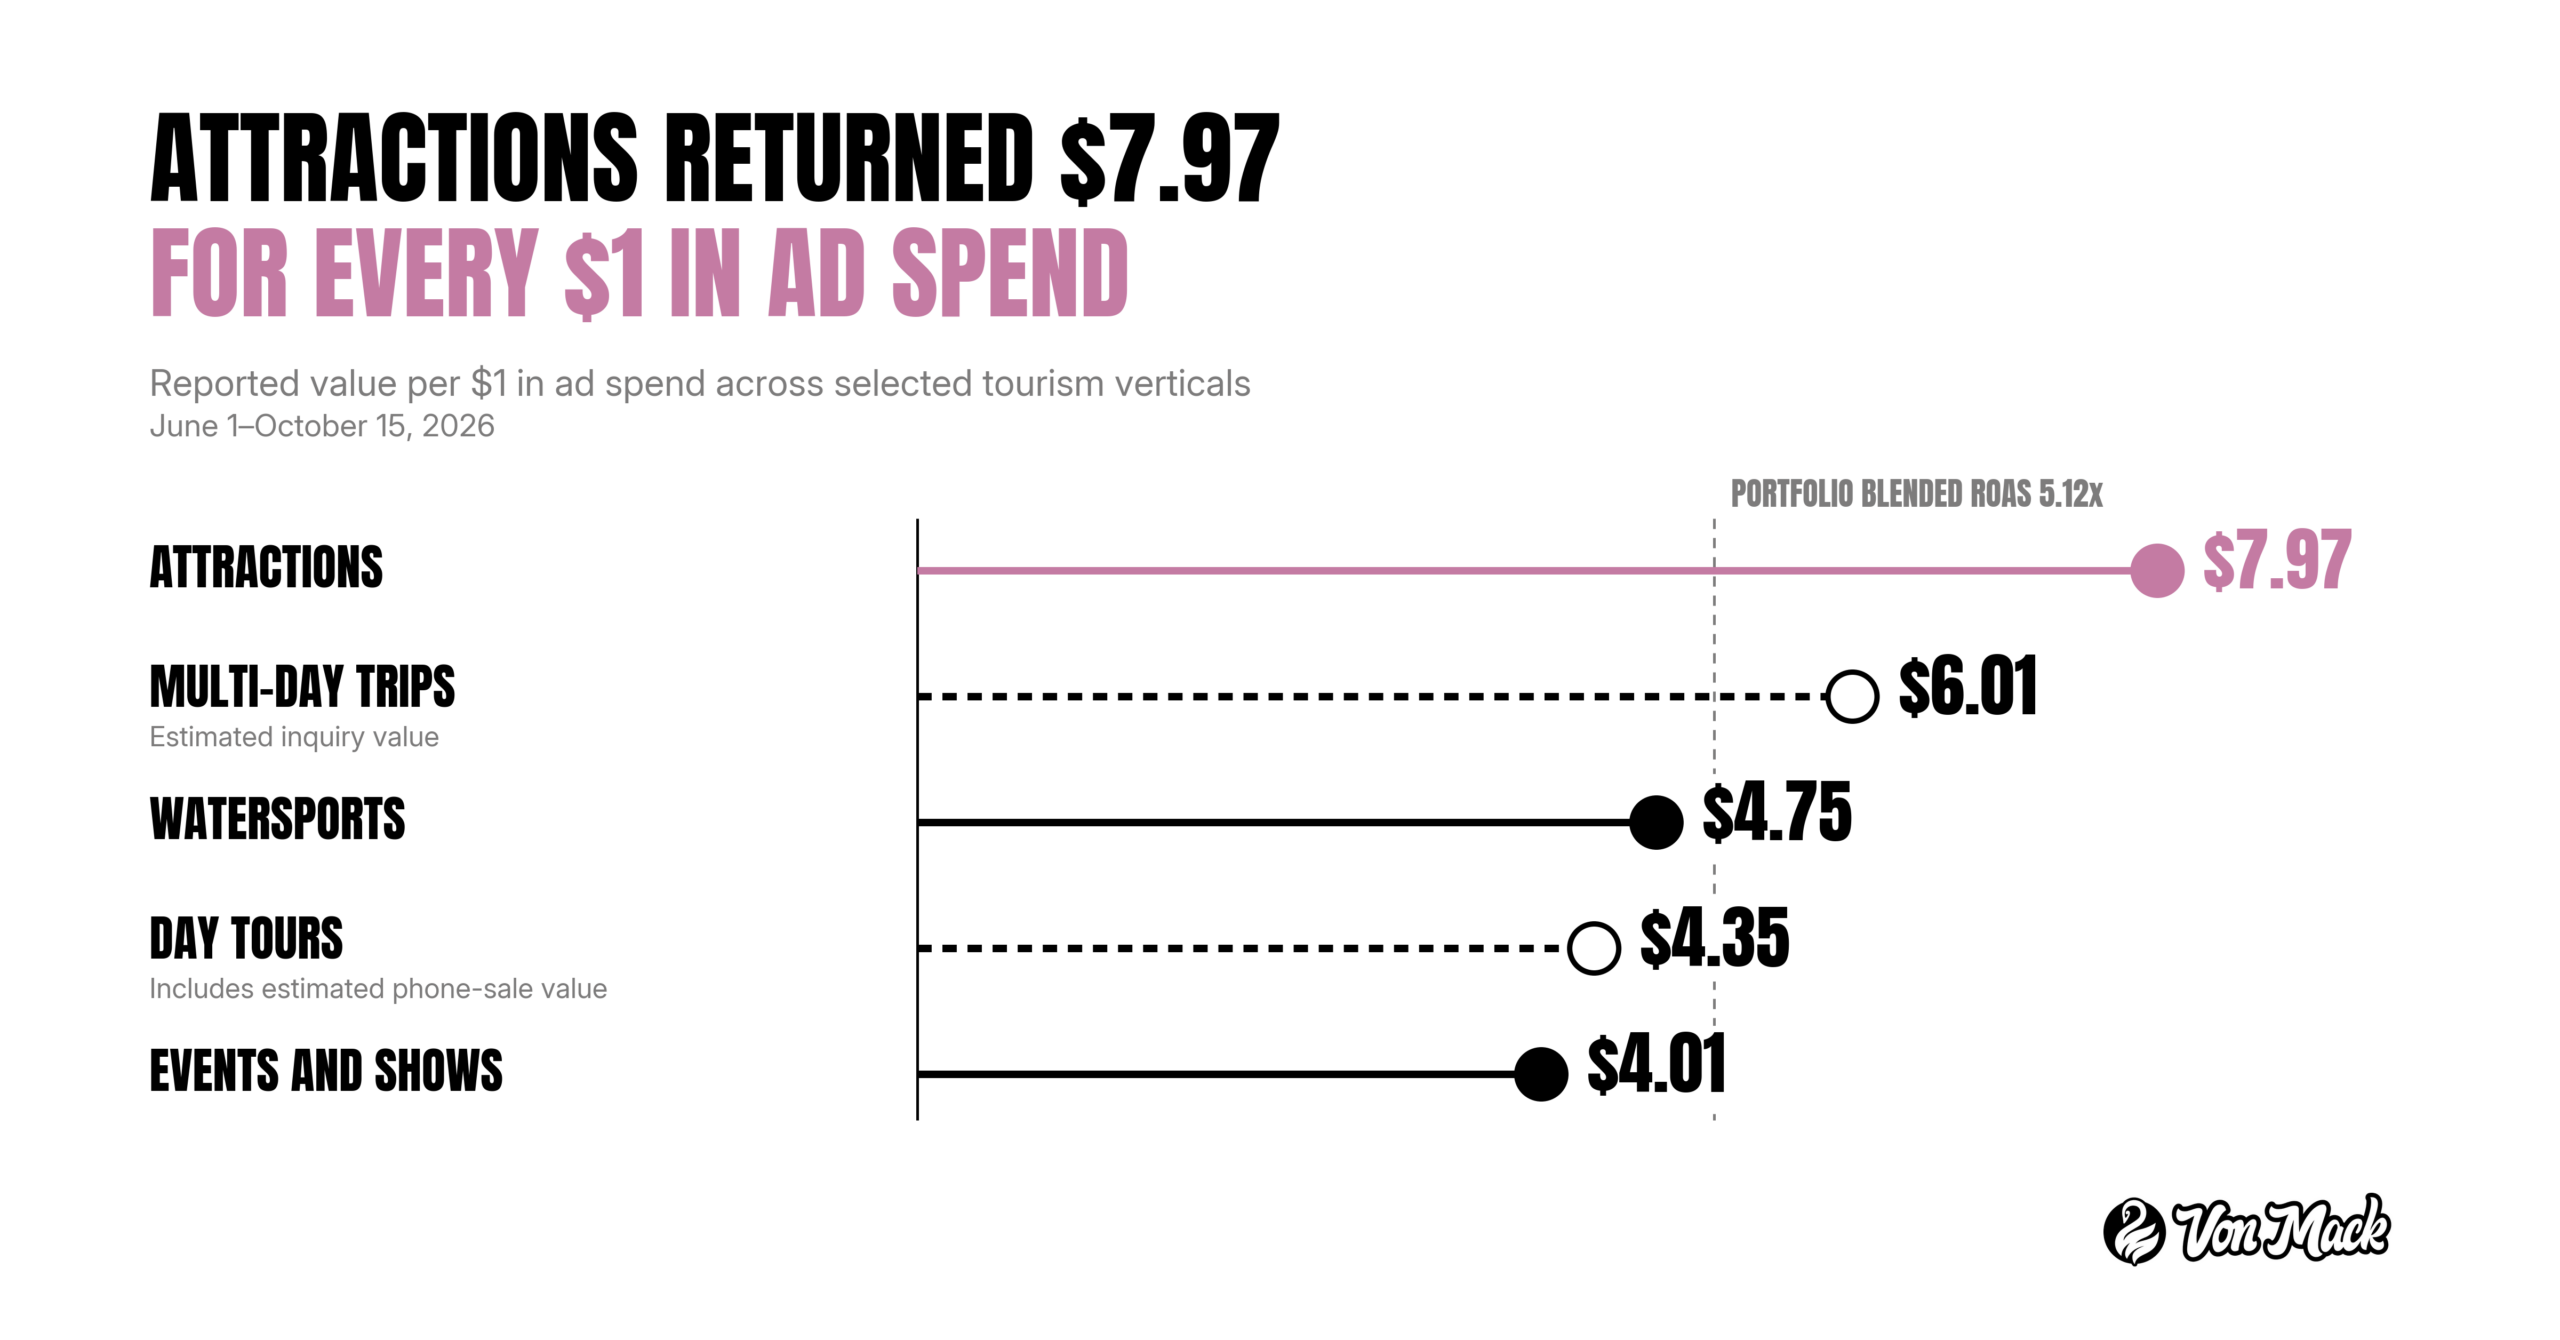
The breakdown below covers selected tourism verticals. Here, you can see each return alongside its booking value and sales process. Estimated inquiry values, phone-sale values, and costs per lead are identified separately.
| Vertical | Revenue per Booking | Ad Spend per Booking or Lead |
|---|---|---|
| Attractions | $177 | $22 per booking |
| Multi-Day Trips | Measured by inquiry | $21 per lead |
| Watersports | $342 | $72 per booking |
| Day Tours | $153, estimated | $35 per sale, estimated |
| Events and Shows | $536 | $133 per booking |
Watersports
Looking into watersports: parasailing, snorkeling, jet skis, boat rentals, dolphin and eco tours, tiki and sunset cruises, and sailing charters were the engine of the season.
Within this study, watersports revenue was concentrated in midsummer, with 40% reported in July and 2% in the first half of October. A July tropical storm prompted budget pullbacks across several watersports brands in the same week.
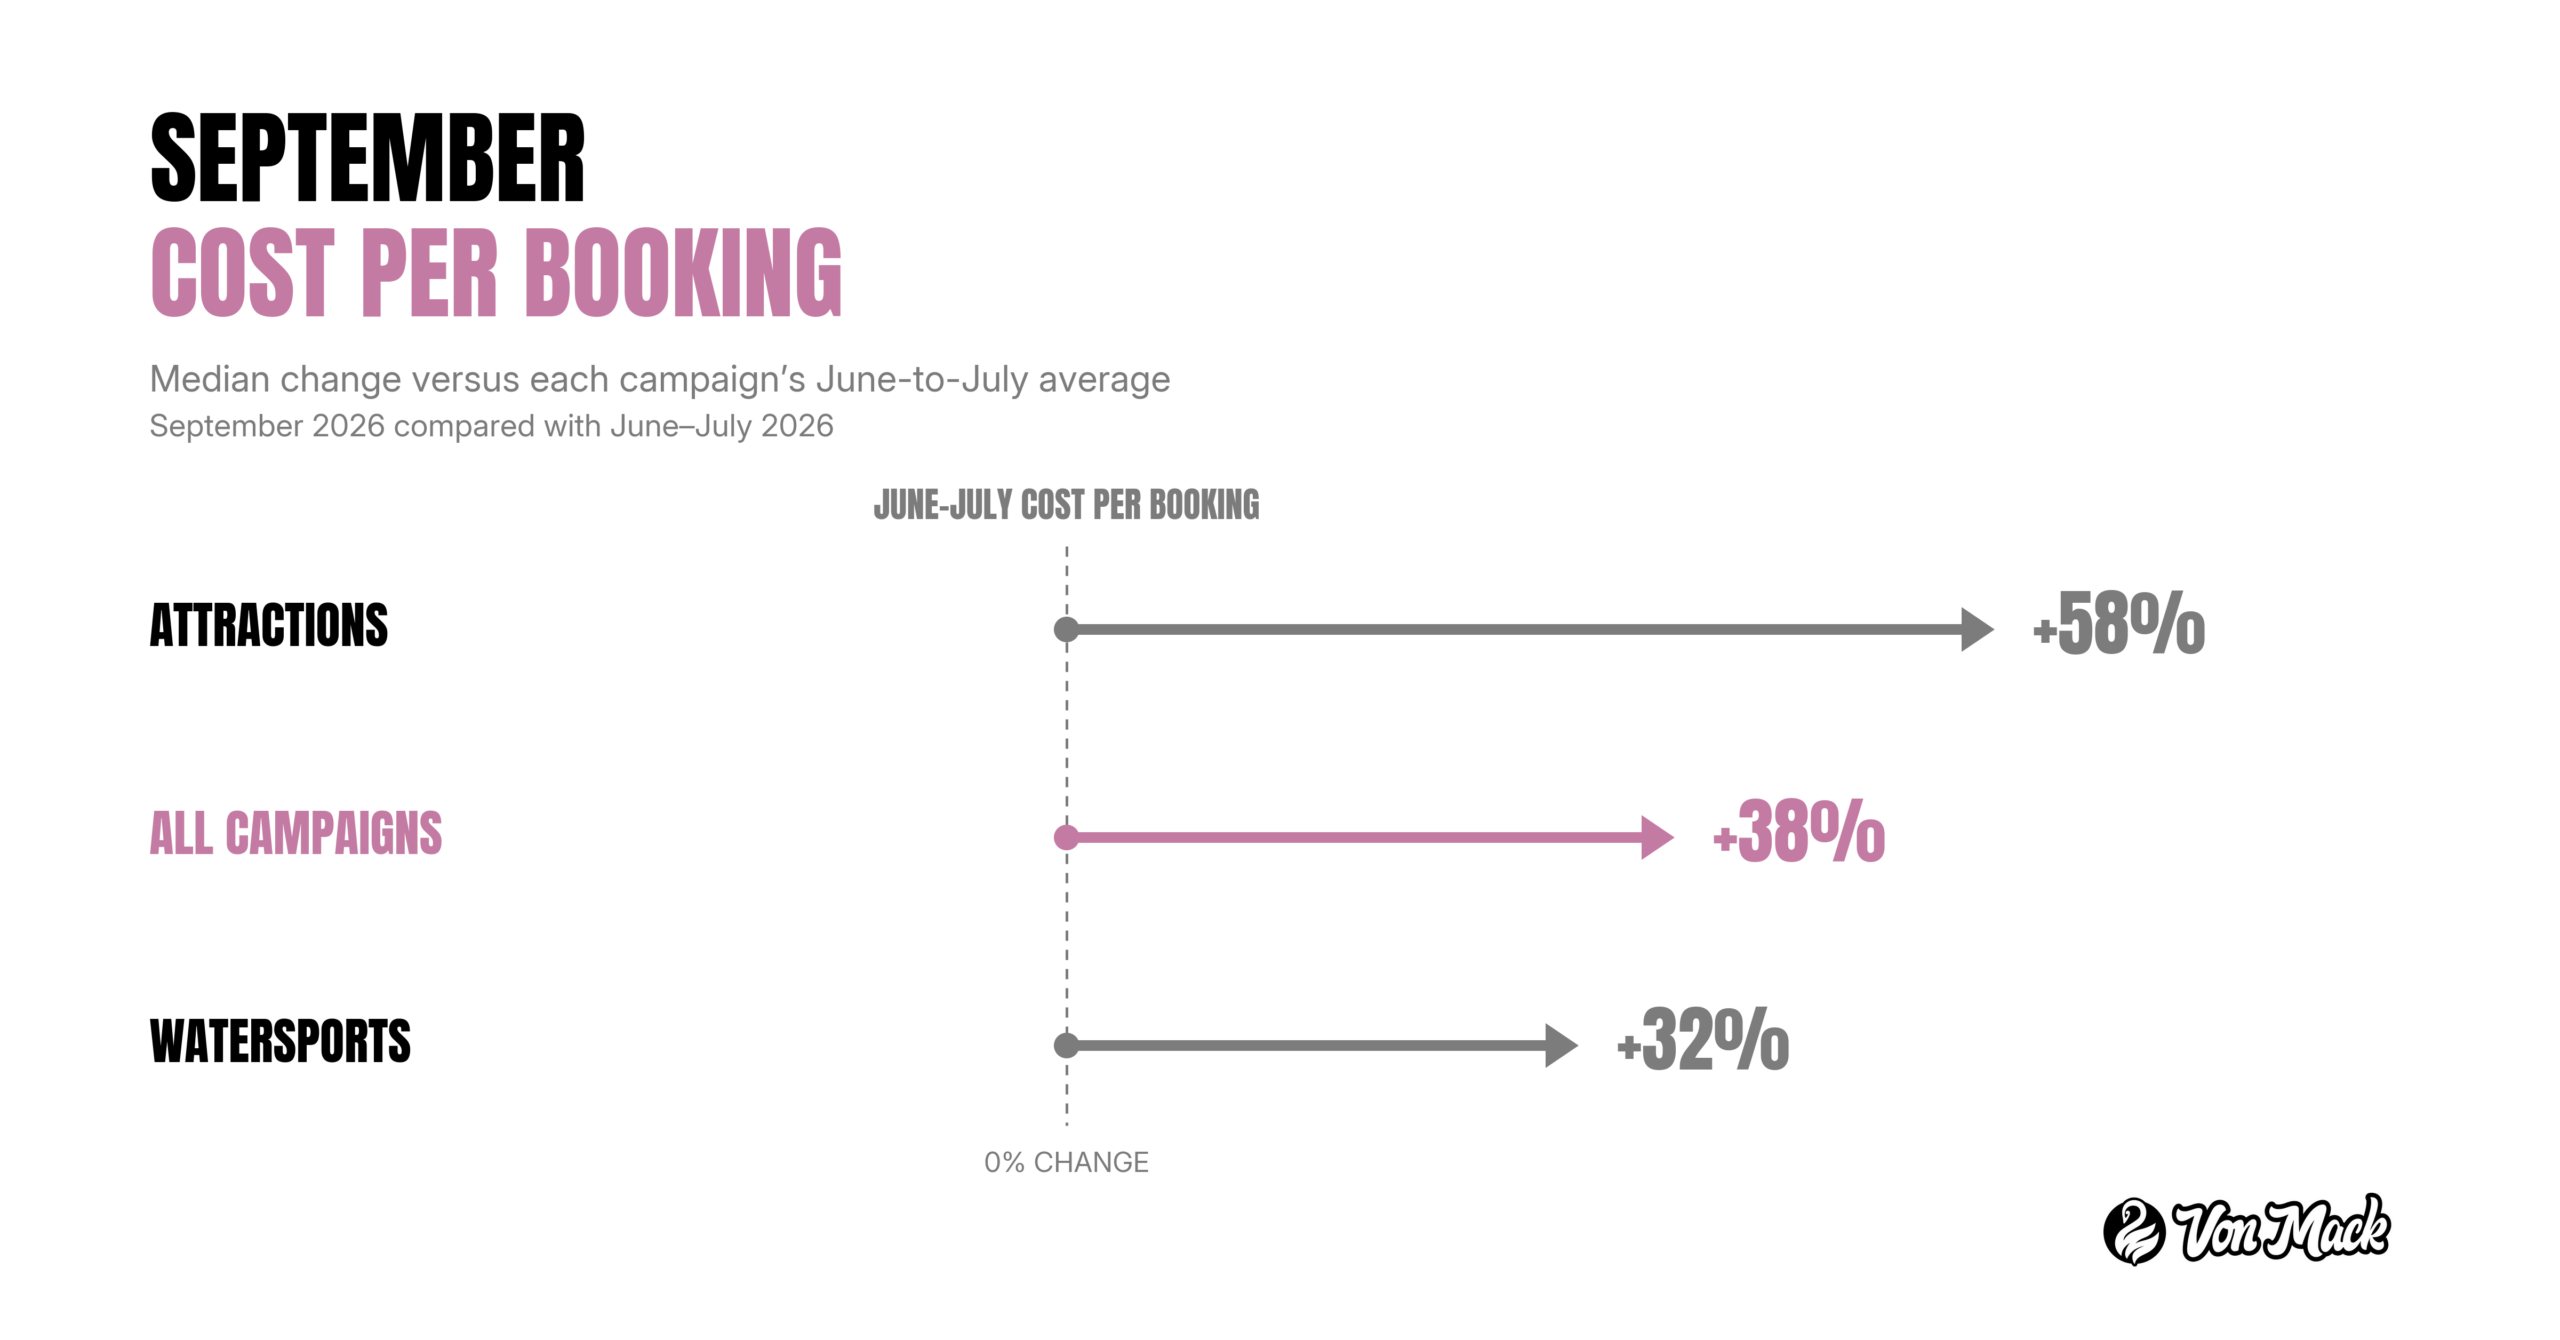
Watersports also held its costs better into the fall: in September, its median cost per booking rose 32%, against 58% for attractions. The top watersports brand returned 14x for the season, and at least a third of watersports brands returned 9x or more. And the phones never stopped.
Across watersports campaigns, blended ROAS was 5.9x on Meta and 4.4x on Google.
Attractions
Attractions had the highest blended ROAS among the verticals reviewed, at approximately 8.0x, with $22 in ad spend per booking.
In September, its median cost per booking rose 58%.
On Meta alone, it returned 9.4x!
Day Tours
City and sightseeing tours ran on a later calendar than most of our study’s segments.
After a slow start to the summer, our day-tour campaigns returned an estimated 4.35x ROAS, at about $35 per sale once phone sales are counted.
Much of their demand came by phone, so we bid toward call leads as well as purchases, and in early July we started counting call value in revenue. Their revenue peaked in August and September as the fall busy season approached.
Events and Shows
Events and shows averaged $536 in revenue per booking, the highest booking value among the verticals reviewed, with $133 in ad spend per booking.
The vertical brought in a tenth of the season’s revenue, and its top brand returned 5.8x.
Note: Some of these campaigns wrapped in early September, so the vertical’s September numbers are partial.
Multi-Day Trips
Multi-day trips often begin with a conversation and a longer sales process. We worked with clients to assign estimated inquiry values so campaigns could optimize toward that opportunity. Reported returns for this vertical use those estimated values.
Leads cost about $21 each across the season, and cost per lead fell 24% from June to September.
Multi-day activity remained strong later in the study period, with August and September nearly level. Inquiry timing should be considered alongside the booking window and departure calendar.
2) How much phone activity accompanied online bookings?
Among accounts with comparable call and online-booking data, there were 58 calls for every 100 online bookings.
For the most call-heavy brands, the phone outran the checkout: they recorded more calls than online bookings during the call-reporting period.
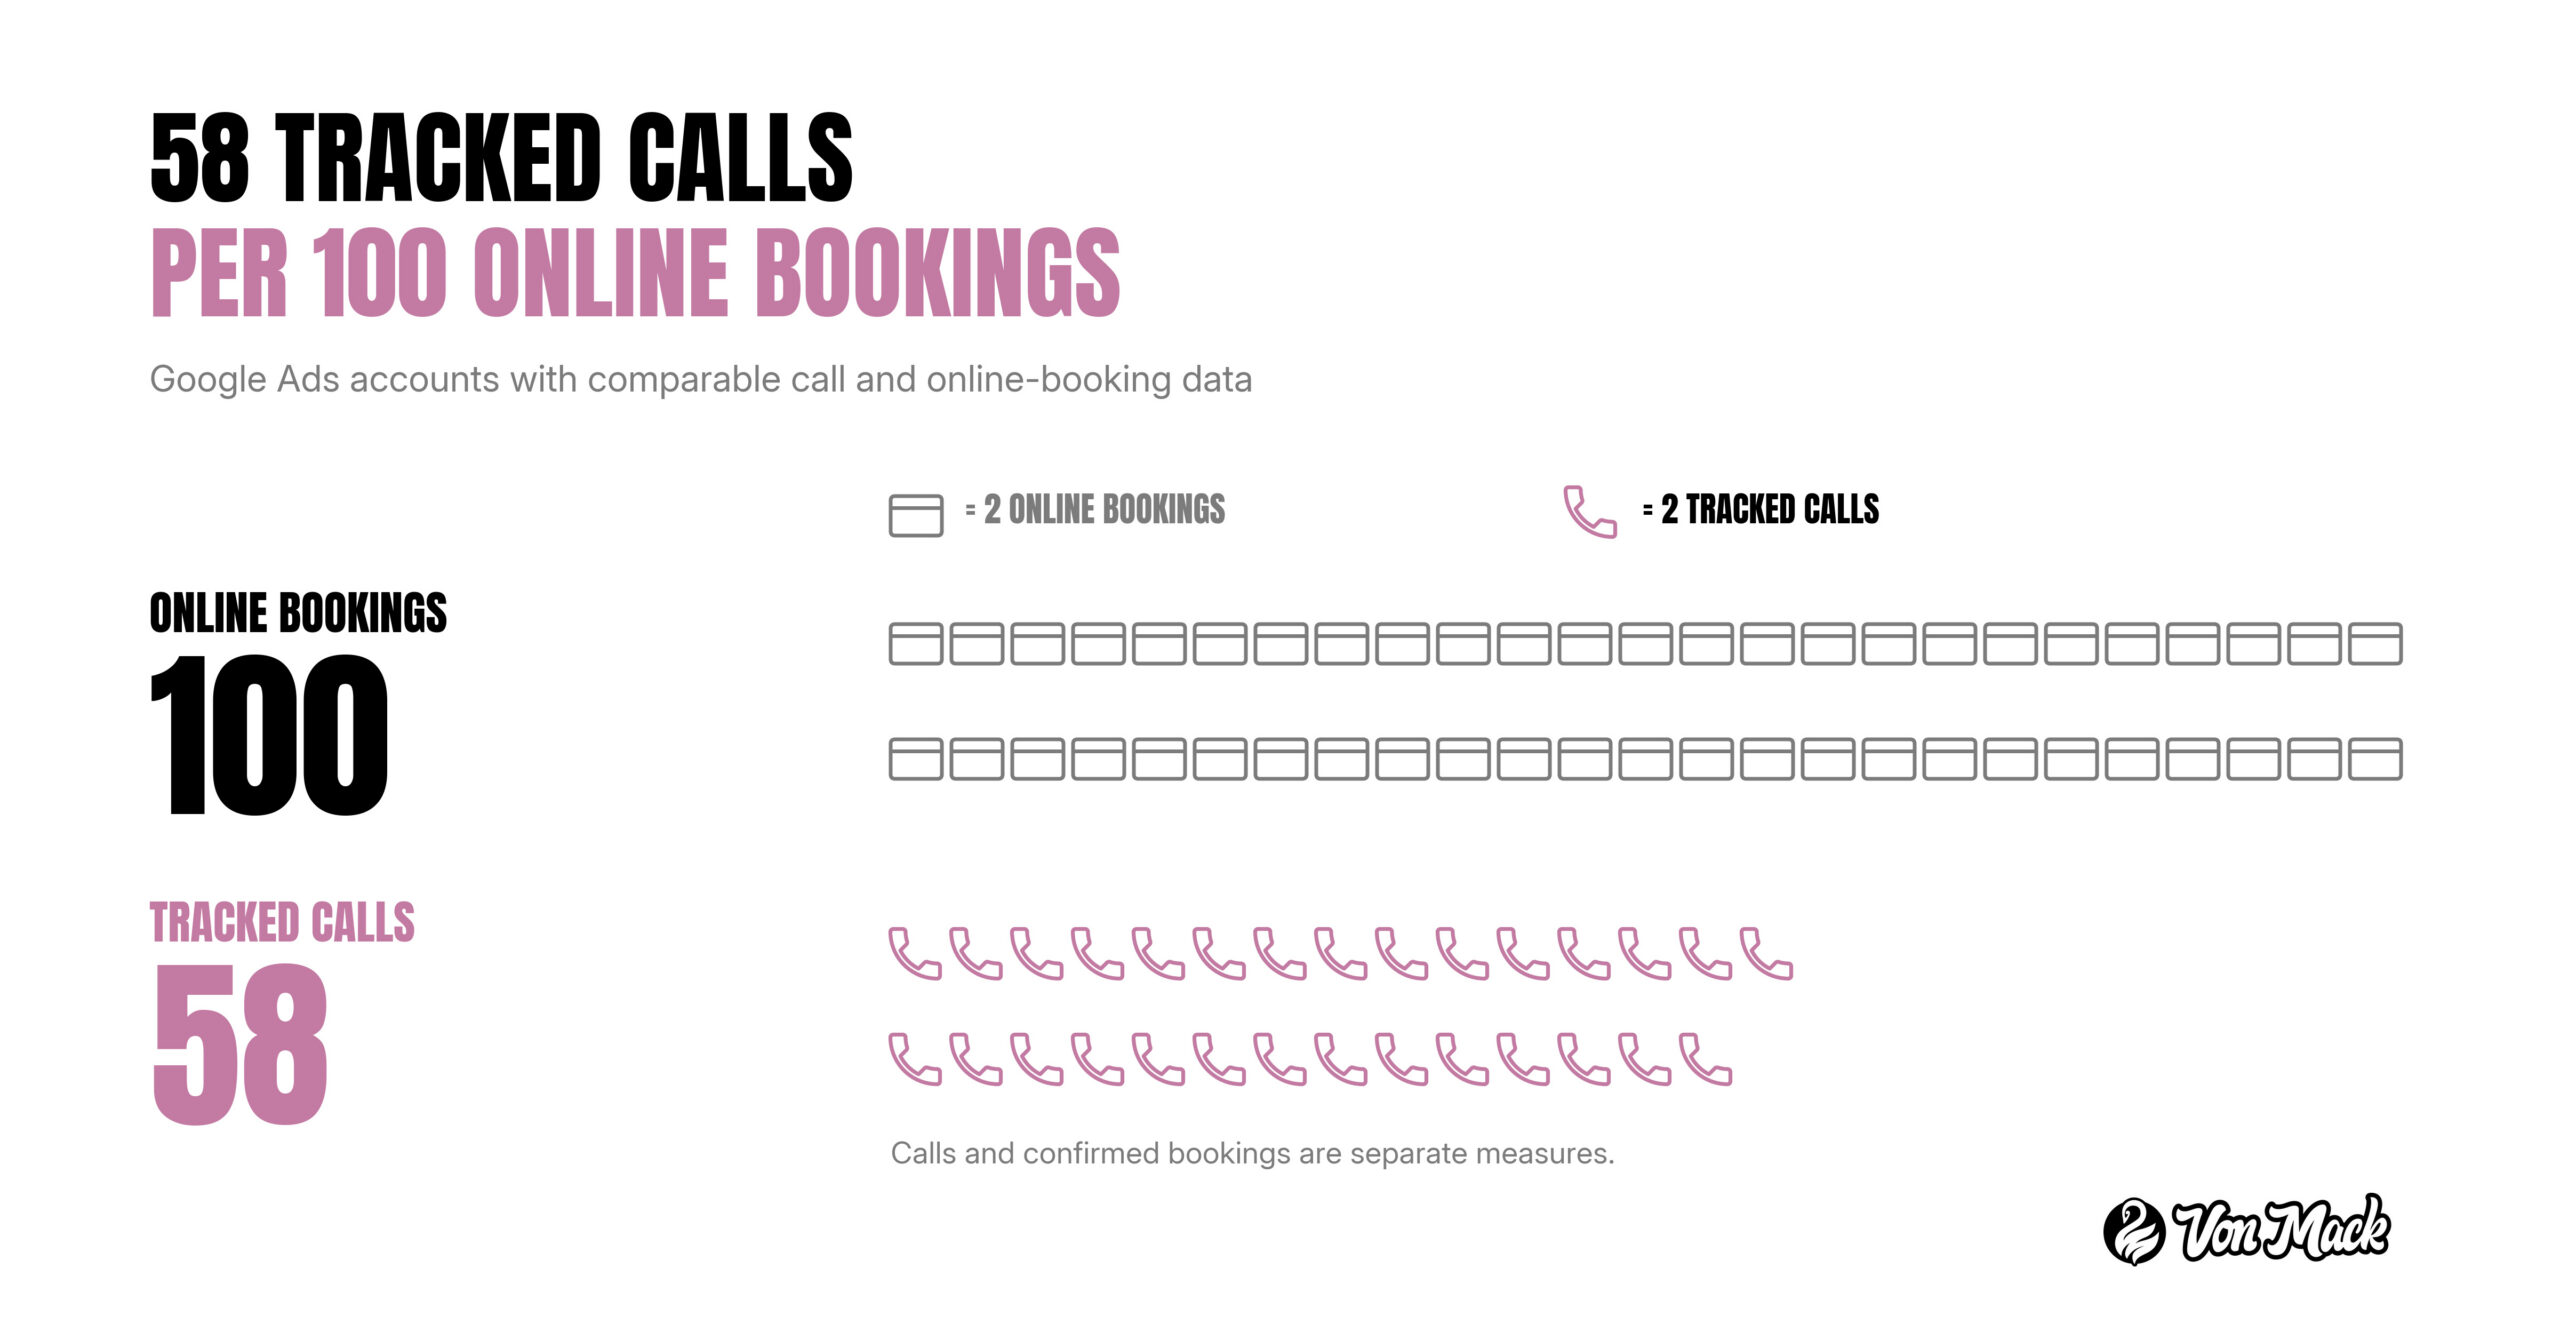
Calls became more prominent relative to online bookings as summer progressed. Among the same tracked brands, the ratio increased from 76 calls per 100 online bookings in August to 104 in September.
A conversation with reservations can be part of the path to purchase. Calls can also include questions and service requests, so tracked calls and confirmed bookings are reported separately. Phocuswright and Arival’s 2026 research also highlights the continued importance of offline purchasing in tours, activities and attractions.
3) Does a good ROAS mean you should spend more on ads?
Possibly. A strong ROAS is a reason to examine the opportunity to grow. Whether to keep scaling depends on available capacity, margins, and the client’s acquisition target.
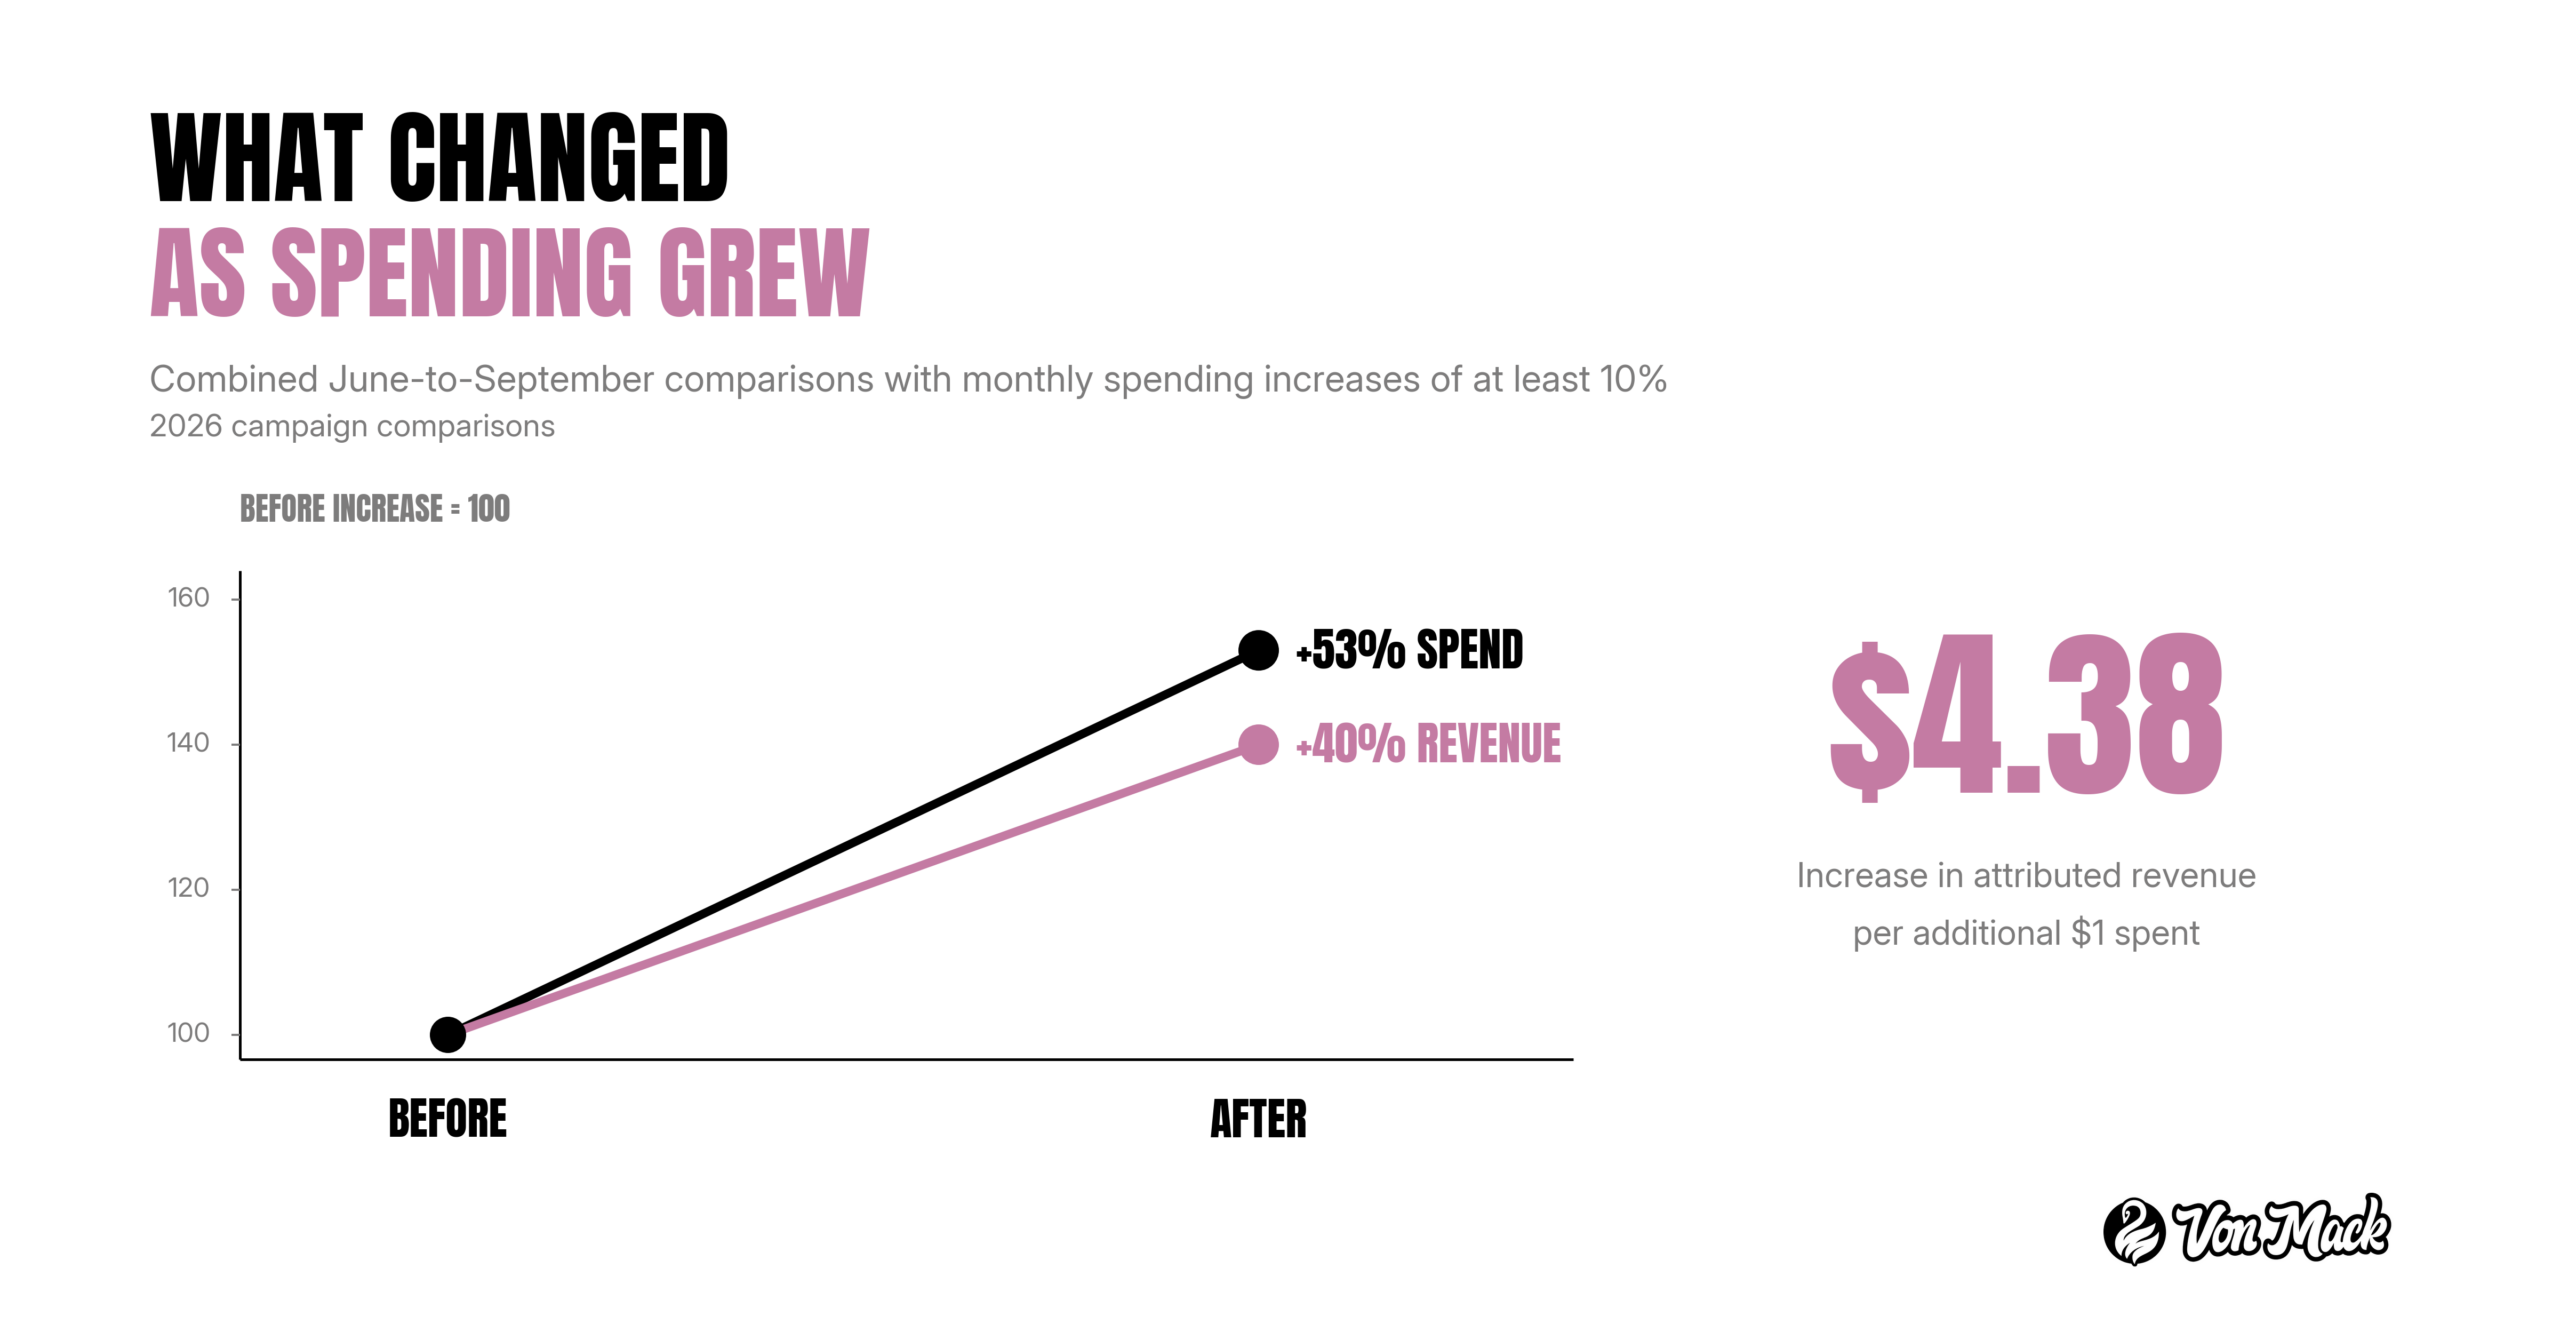
- Across the June-to-September comparisons with monthly spending increases of at least 10%, combined spend rose 53%, and attributed revenue rose 40%.
- The total increase in attributed revenue was $4.38 for each additional $1 spent, compared with $5.76 in revenue per dollar before the increases.
- ROAS was lower in 64% of those comparisons, even as combined revenue grew.
Does spending less improve ROAS?
Results vary here. For example, one attraction’s September results illustrate a clear distinction between revenue growth and ROAS. Compared with the previous year, attributed revenue increased while corresponding ROAS declined. The increase in attributed revenue was approximately three times the increase in ad spend.
But this is not always the case.
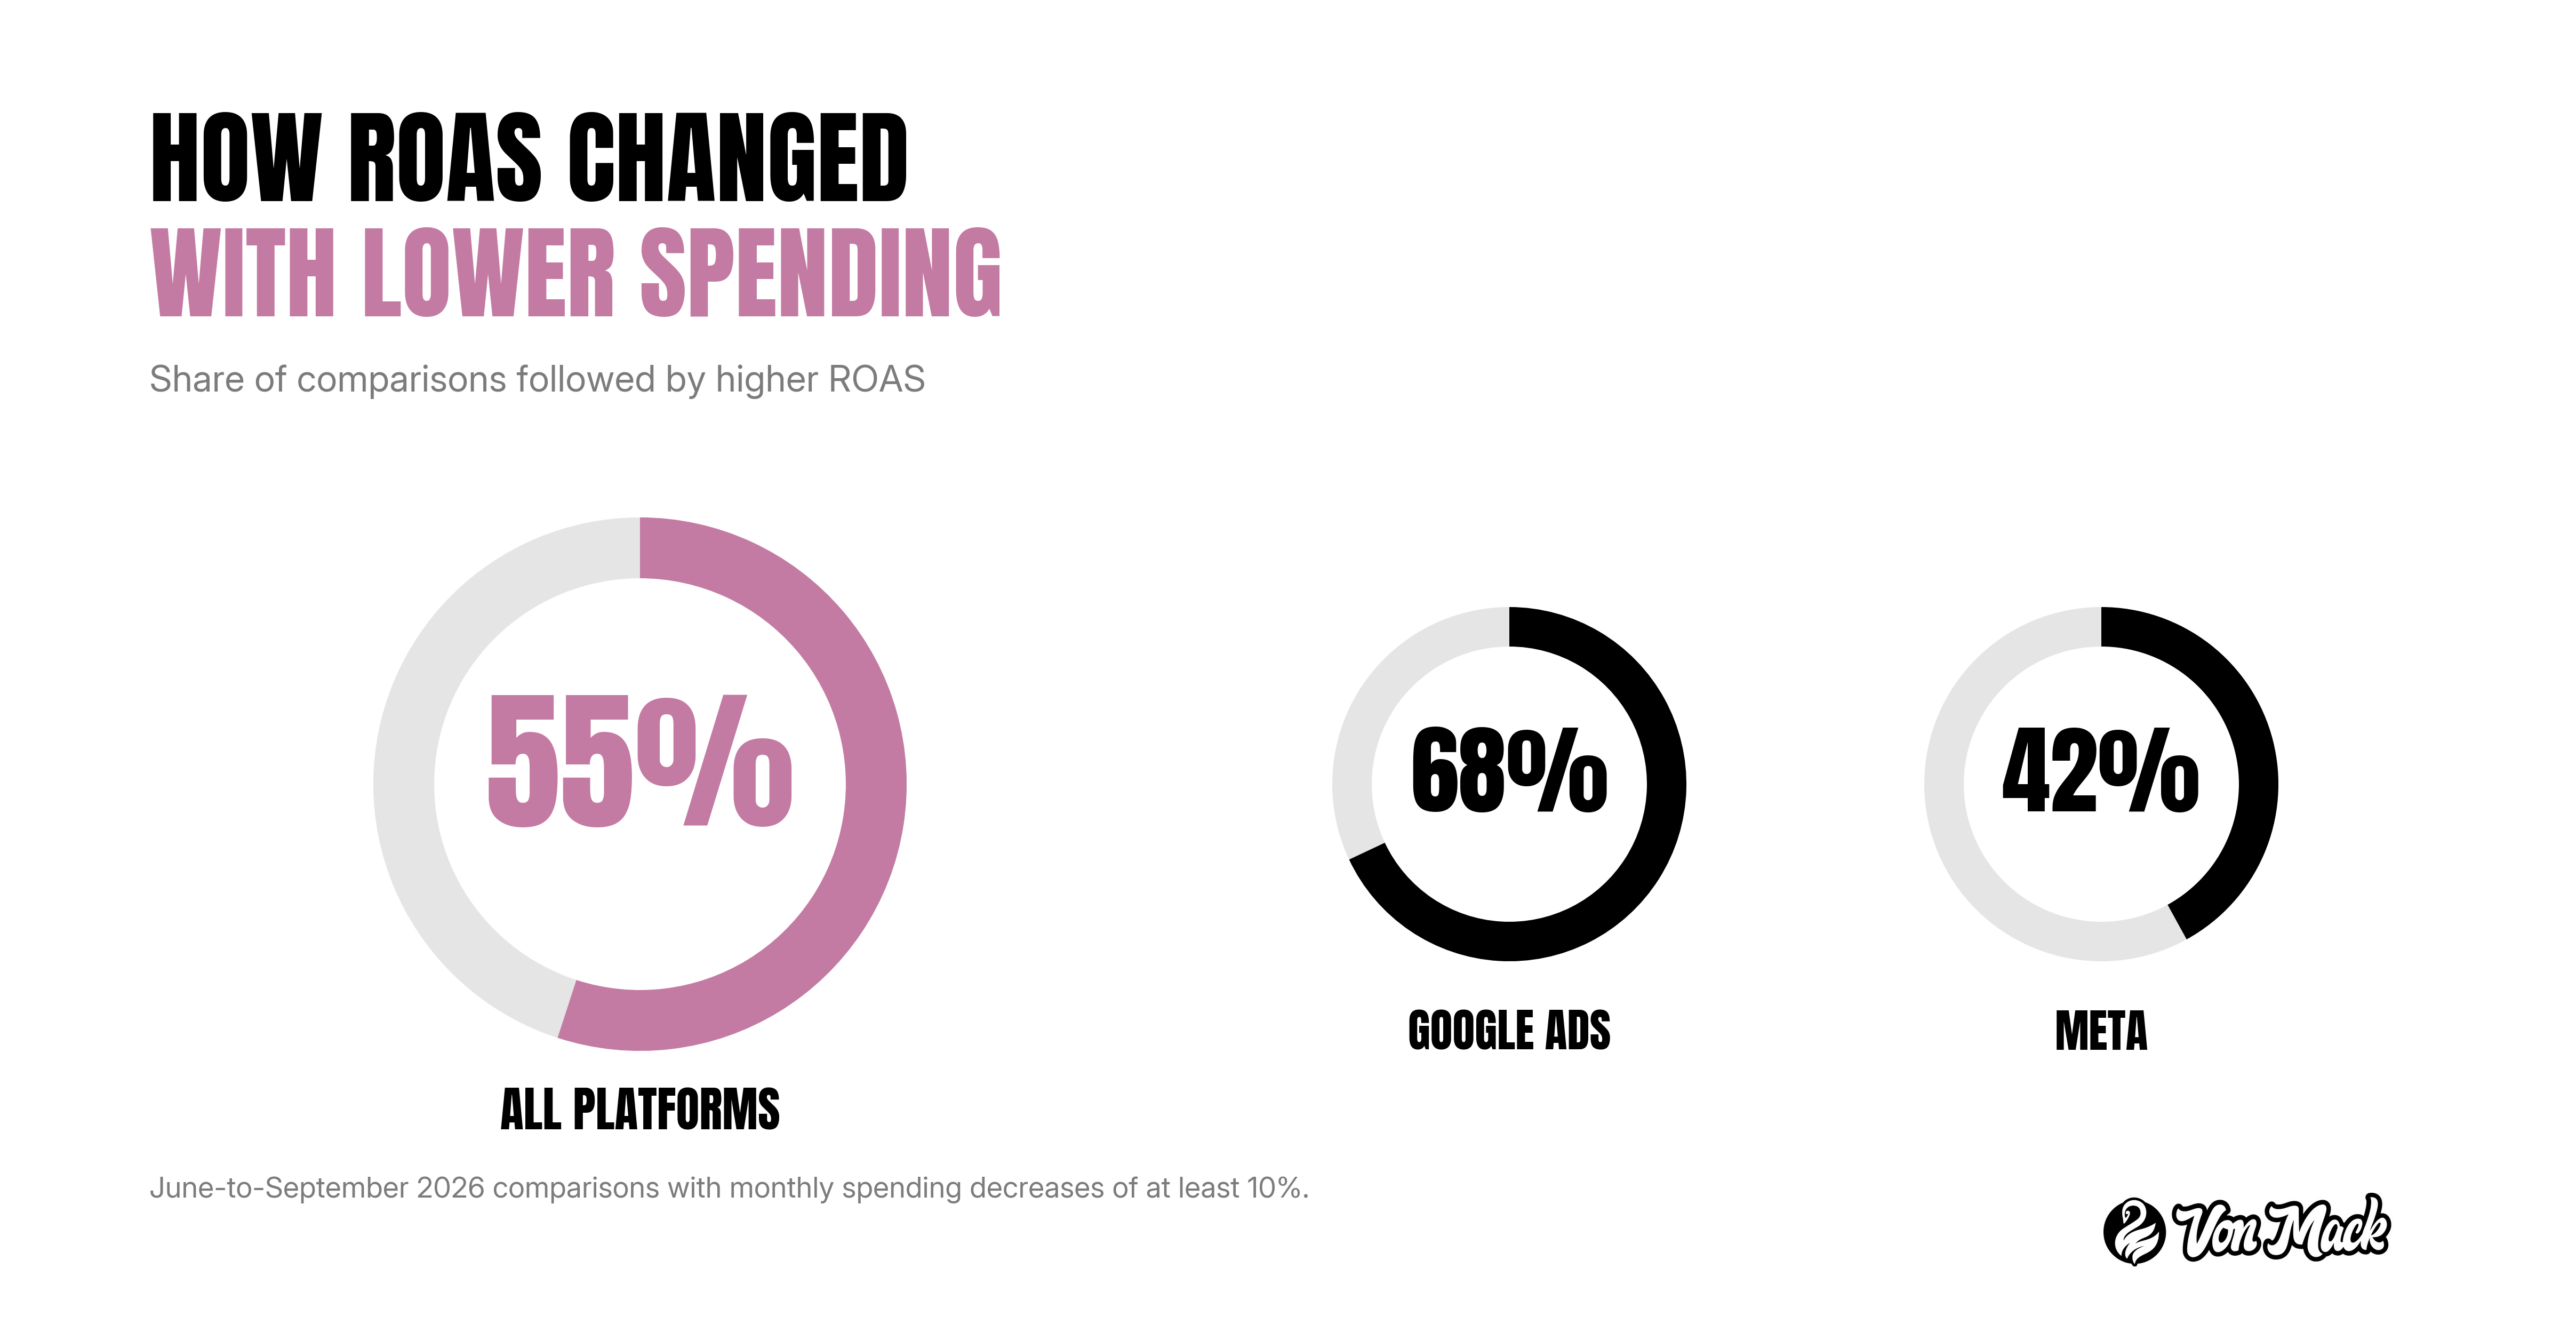
In 55% of the June-to-September comparisons involving spending decreases of at least 10%, lower monthly spending was followed by higher ROAS. The figure was 68% for Google and 42% for Meta.
To us, spending decisions depend on demand, available departures, and the client’s goals.
Before a raise, we ask three questions at Von Mack:
“Are there seats left?” When one sailing company’s best-selling promo kept selling out, we moved the push to its other sailings.
“Are there people left?” We check search volume and audience size.
“Does the next dollar still pay?” We review the return on added spend alongside the account’s overall results. When a late-September raise held one account’s ROAS above its monthly average, we raised it again by 25%.
Before a cut, we find out what’s actually moving: weather, school calendars, a sold-out date, the offer, the price per booking.
4) Do Google Ads or social ads bring in more money for tour operators?
Depends on how you look at it.
In all, Google’s bookings were worth more. Across this study, Google reported more attributed revenue, while Meta had the higher blended ROAS. In months where both platforms logged at least three bookings, Google brought in more revenue per booking 69% of the time, a median $356 vs. $330 on Meta.
At Von Mack, we build integrated campaigns with blended targets, but generally, we give each platform a job. Meta builds the inspiration and retargets people who almost booked. Google then catches the plan and chimes in towards the sale. Expedia Group’s 2025 Traveler Value Index found that more than 60% of surveyed consumers cited social media as a source of travel inspiration.
In this summer study, the top quarter of our accounts returned 7.8x or better on Google Ads. Google Ads produced $3.3M of the season’s attributed revenue (66%) on 71% of the spend. A blended Meta produced $1.7M (34%) on 28% of the spend and more than 7x across June and July.
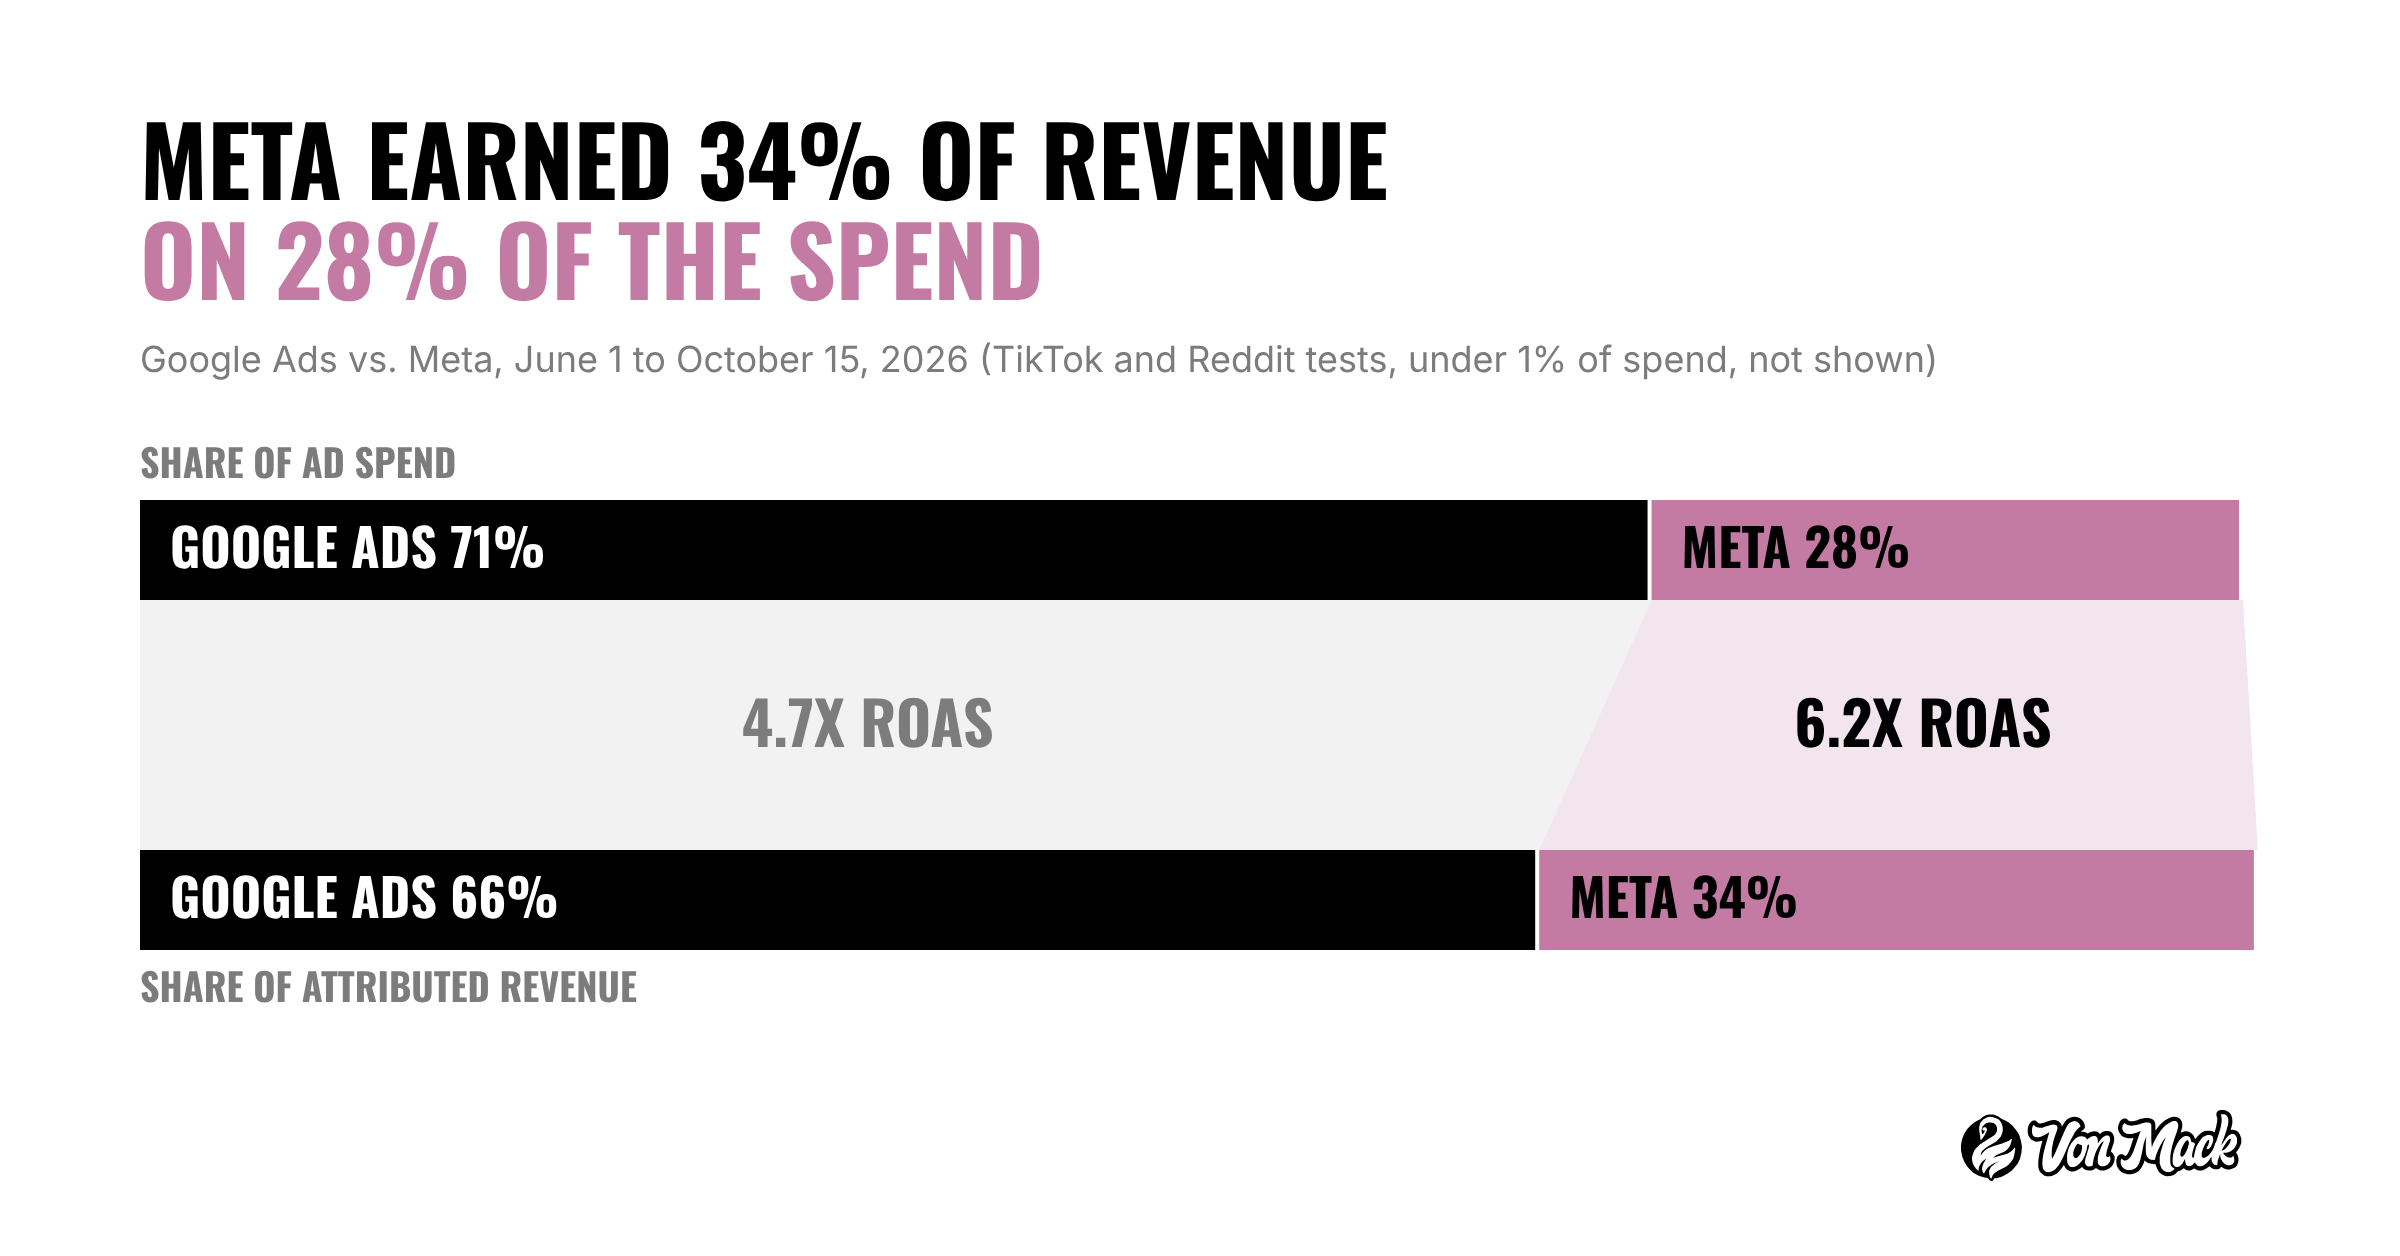
And when comparing within the same brand, head to head, the results were much closer.
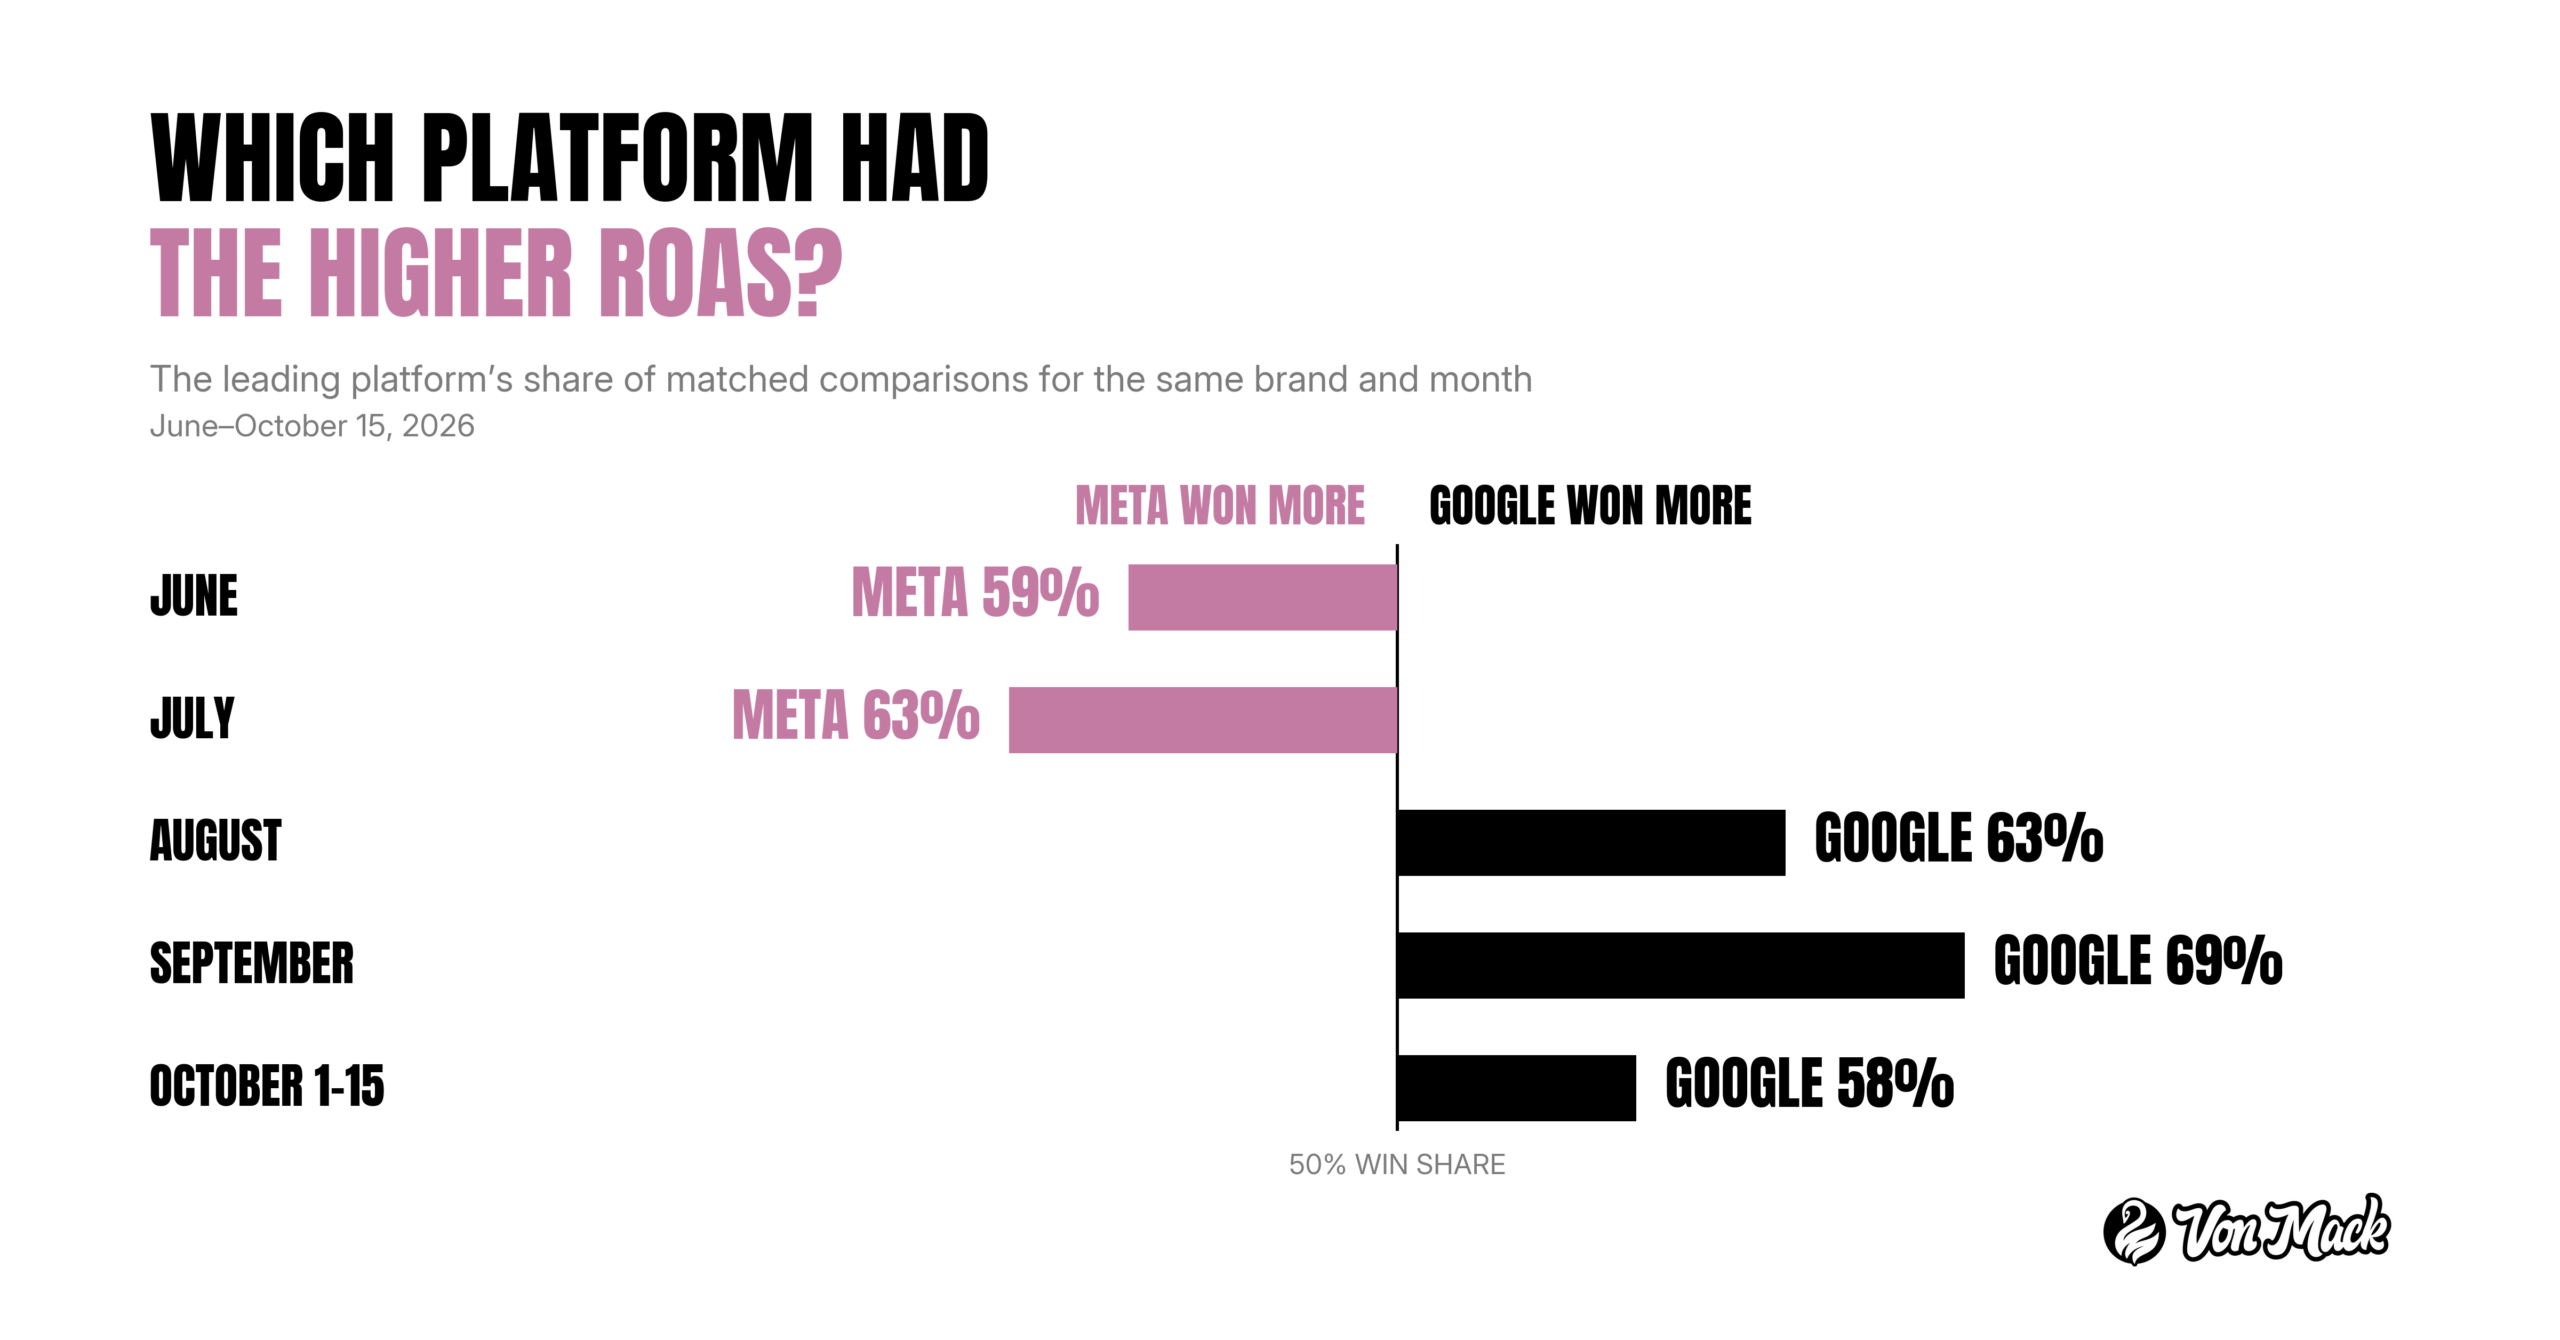
When the same brand ran both platforms in the same month, Meta posted the higher ROAS 47% of the time and Google 53%.
The typical campaign-month landed in nearly the same place on either platform: a median 4.5x on Google and 4.3x on Meta. Meta’s standout accounts ran in the double digits, which lifted its blended number.
The head-to-head results varied by month.
- Meta had the higher ROAS in most matched comparisons in June and July.
- Google led in most comparisons from August through October 15.
5) When did attributed revenue peak in this study?
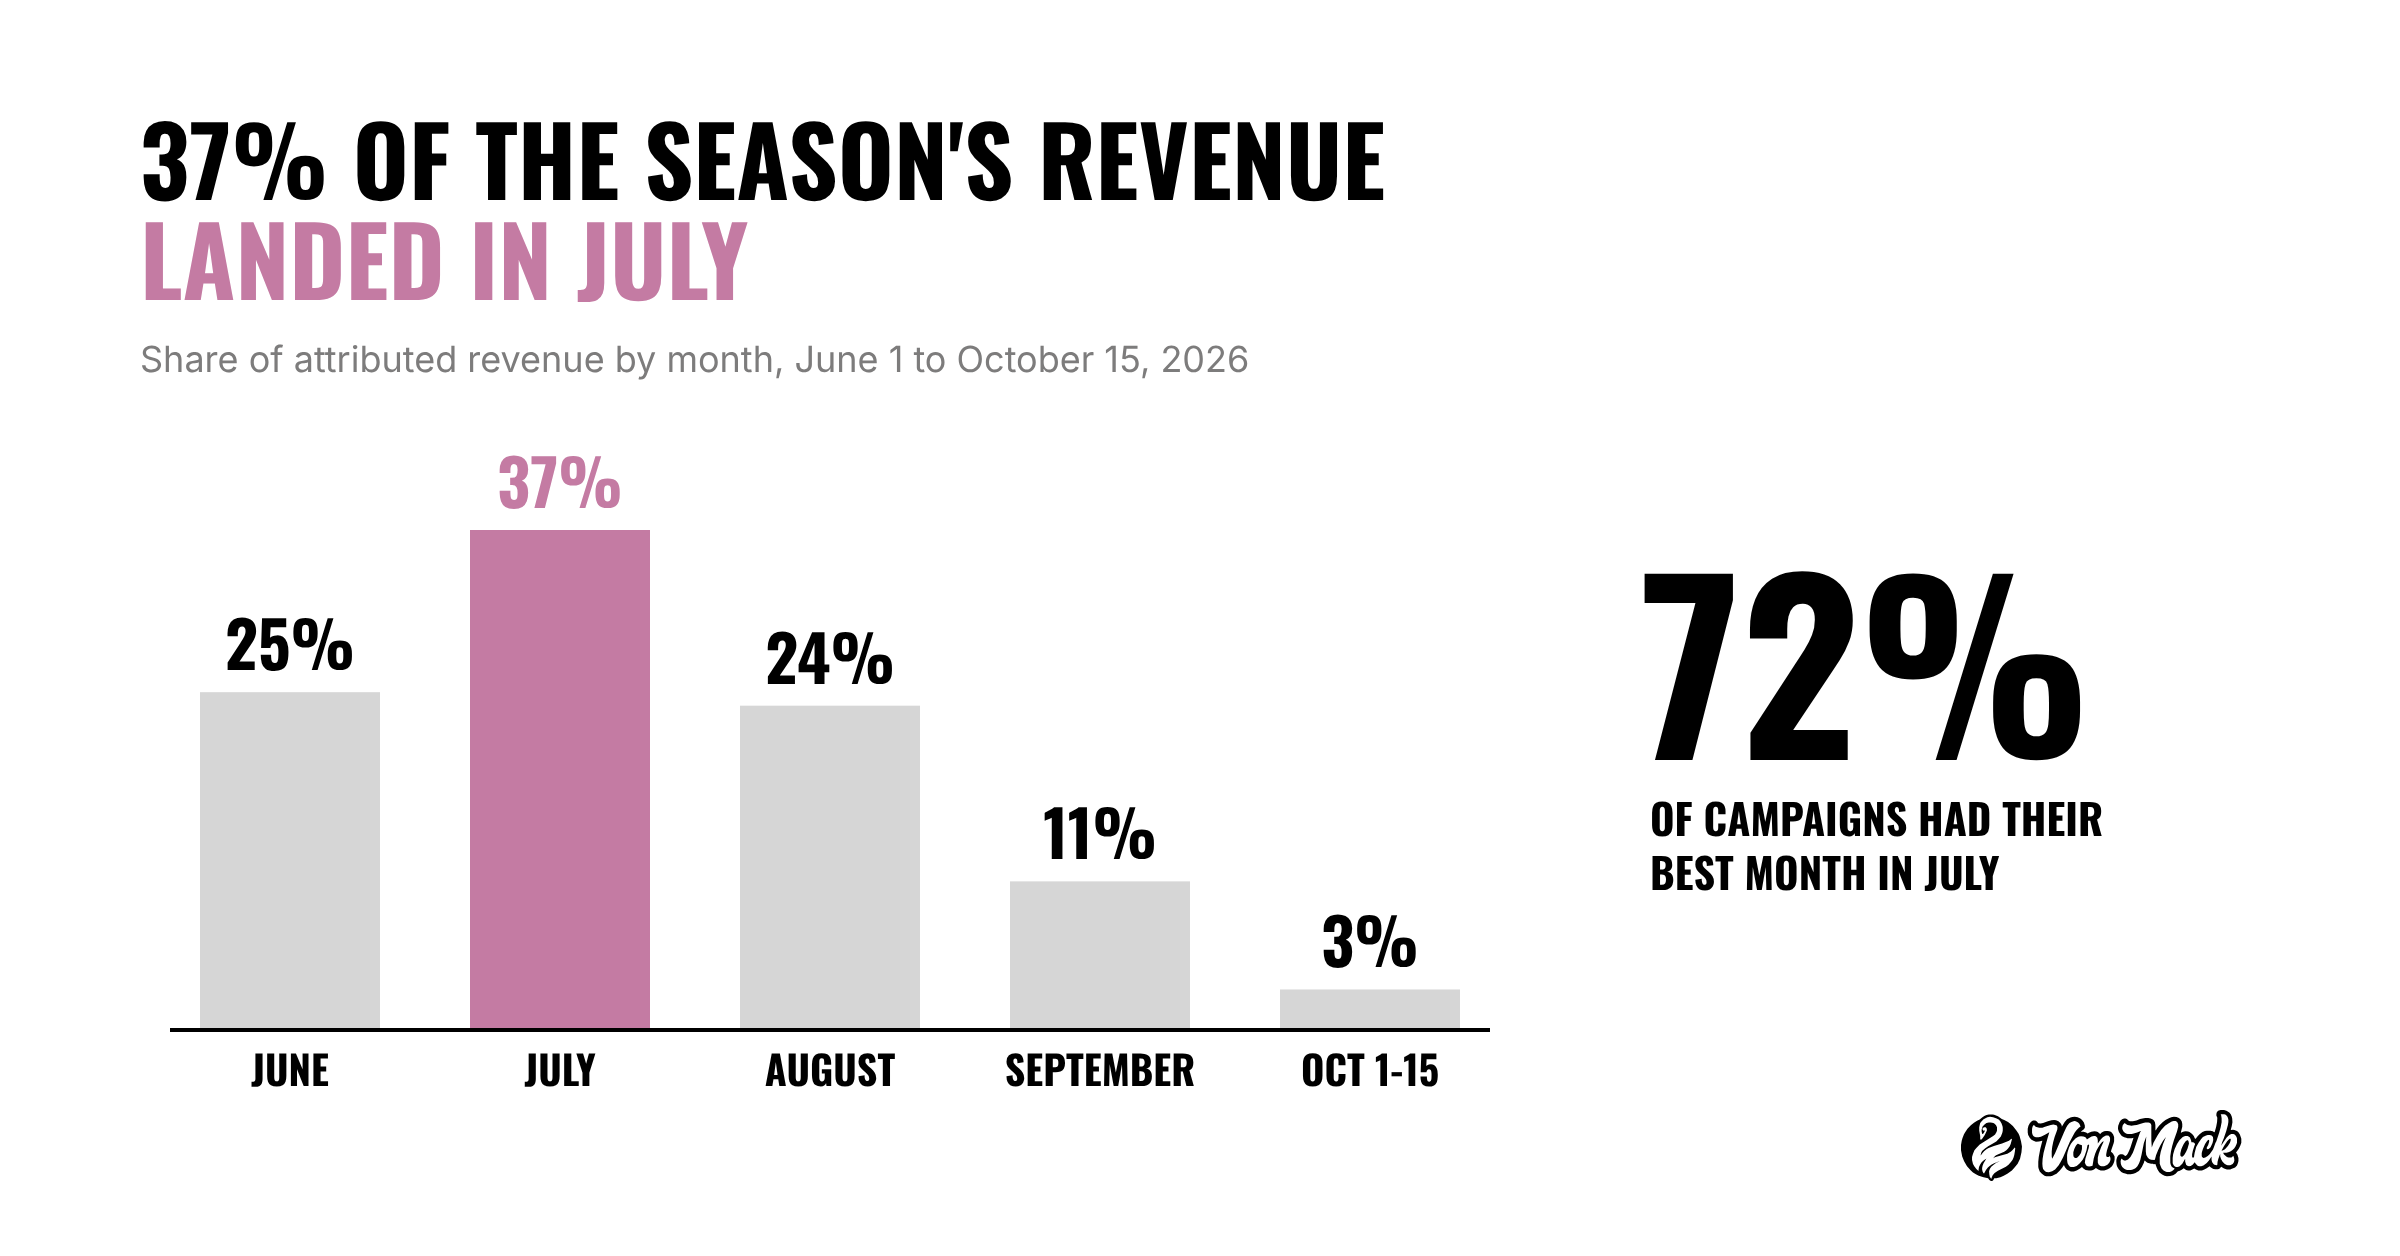
July led within this study period, accounting for 37% of attributed revenue, approximately $1.9 million of the reported $5 million. June accounted for 25%, August 24%, and September 11%. The first half of October added 3%.
Watersports accounted for 63% of the season’s attributed revenue, so that vertical carries substantial weight in the overall pattern. Individual planning should also account for the destination, audience market, and departure calendar.
Measured per day, July brought in more than three times September’s attributed revenue. Blended ROAS declined from 5.4x to 4.7x, while attributed revenue per day fell much more sharply.
The pattern held across the portfolio. More than seven in ten campaigns (72%) had their biggest month in July. For the typical brand, June and July delivered nearly two-thirds of its June-to-September revenue.
We planned spending around each client’s demand, available capacity, and booking window.
In July, budgets went up heading into the holiday weekend. In August, several accounts spent aggressively through the first two weeks, then pulled back as kids went back to school.
When a tropical storm sat offshore, we cut spend for those days and restored it the moment it passed.
6) How closely did early ROAS match the final monthly result?
- Readings from the first ten days differed from the final monthly figure by a median 34%. Only 23% were within 10% of it.
- The median difference narrowed to 23% during days 11–20.
- From day 21 through the end of the month, the median difference narrowed to 9%.
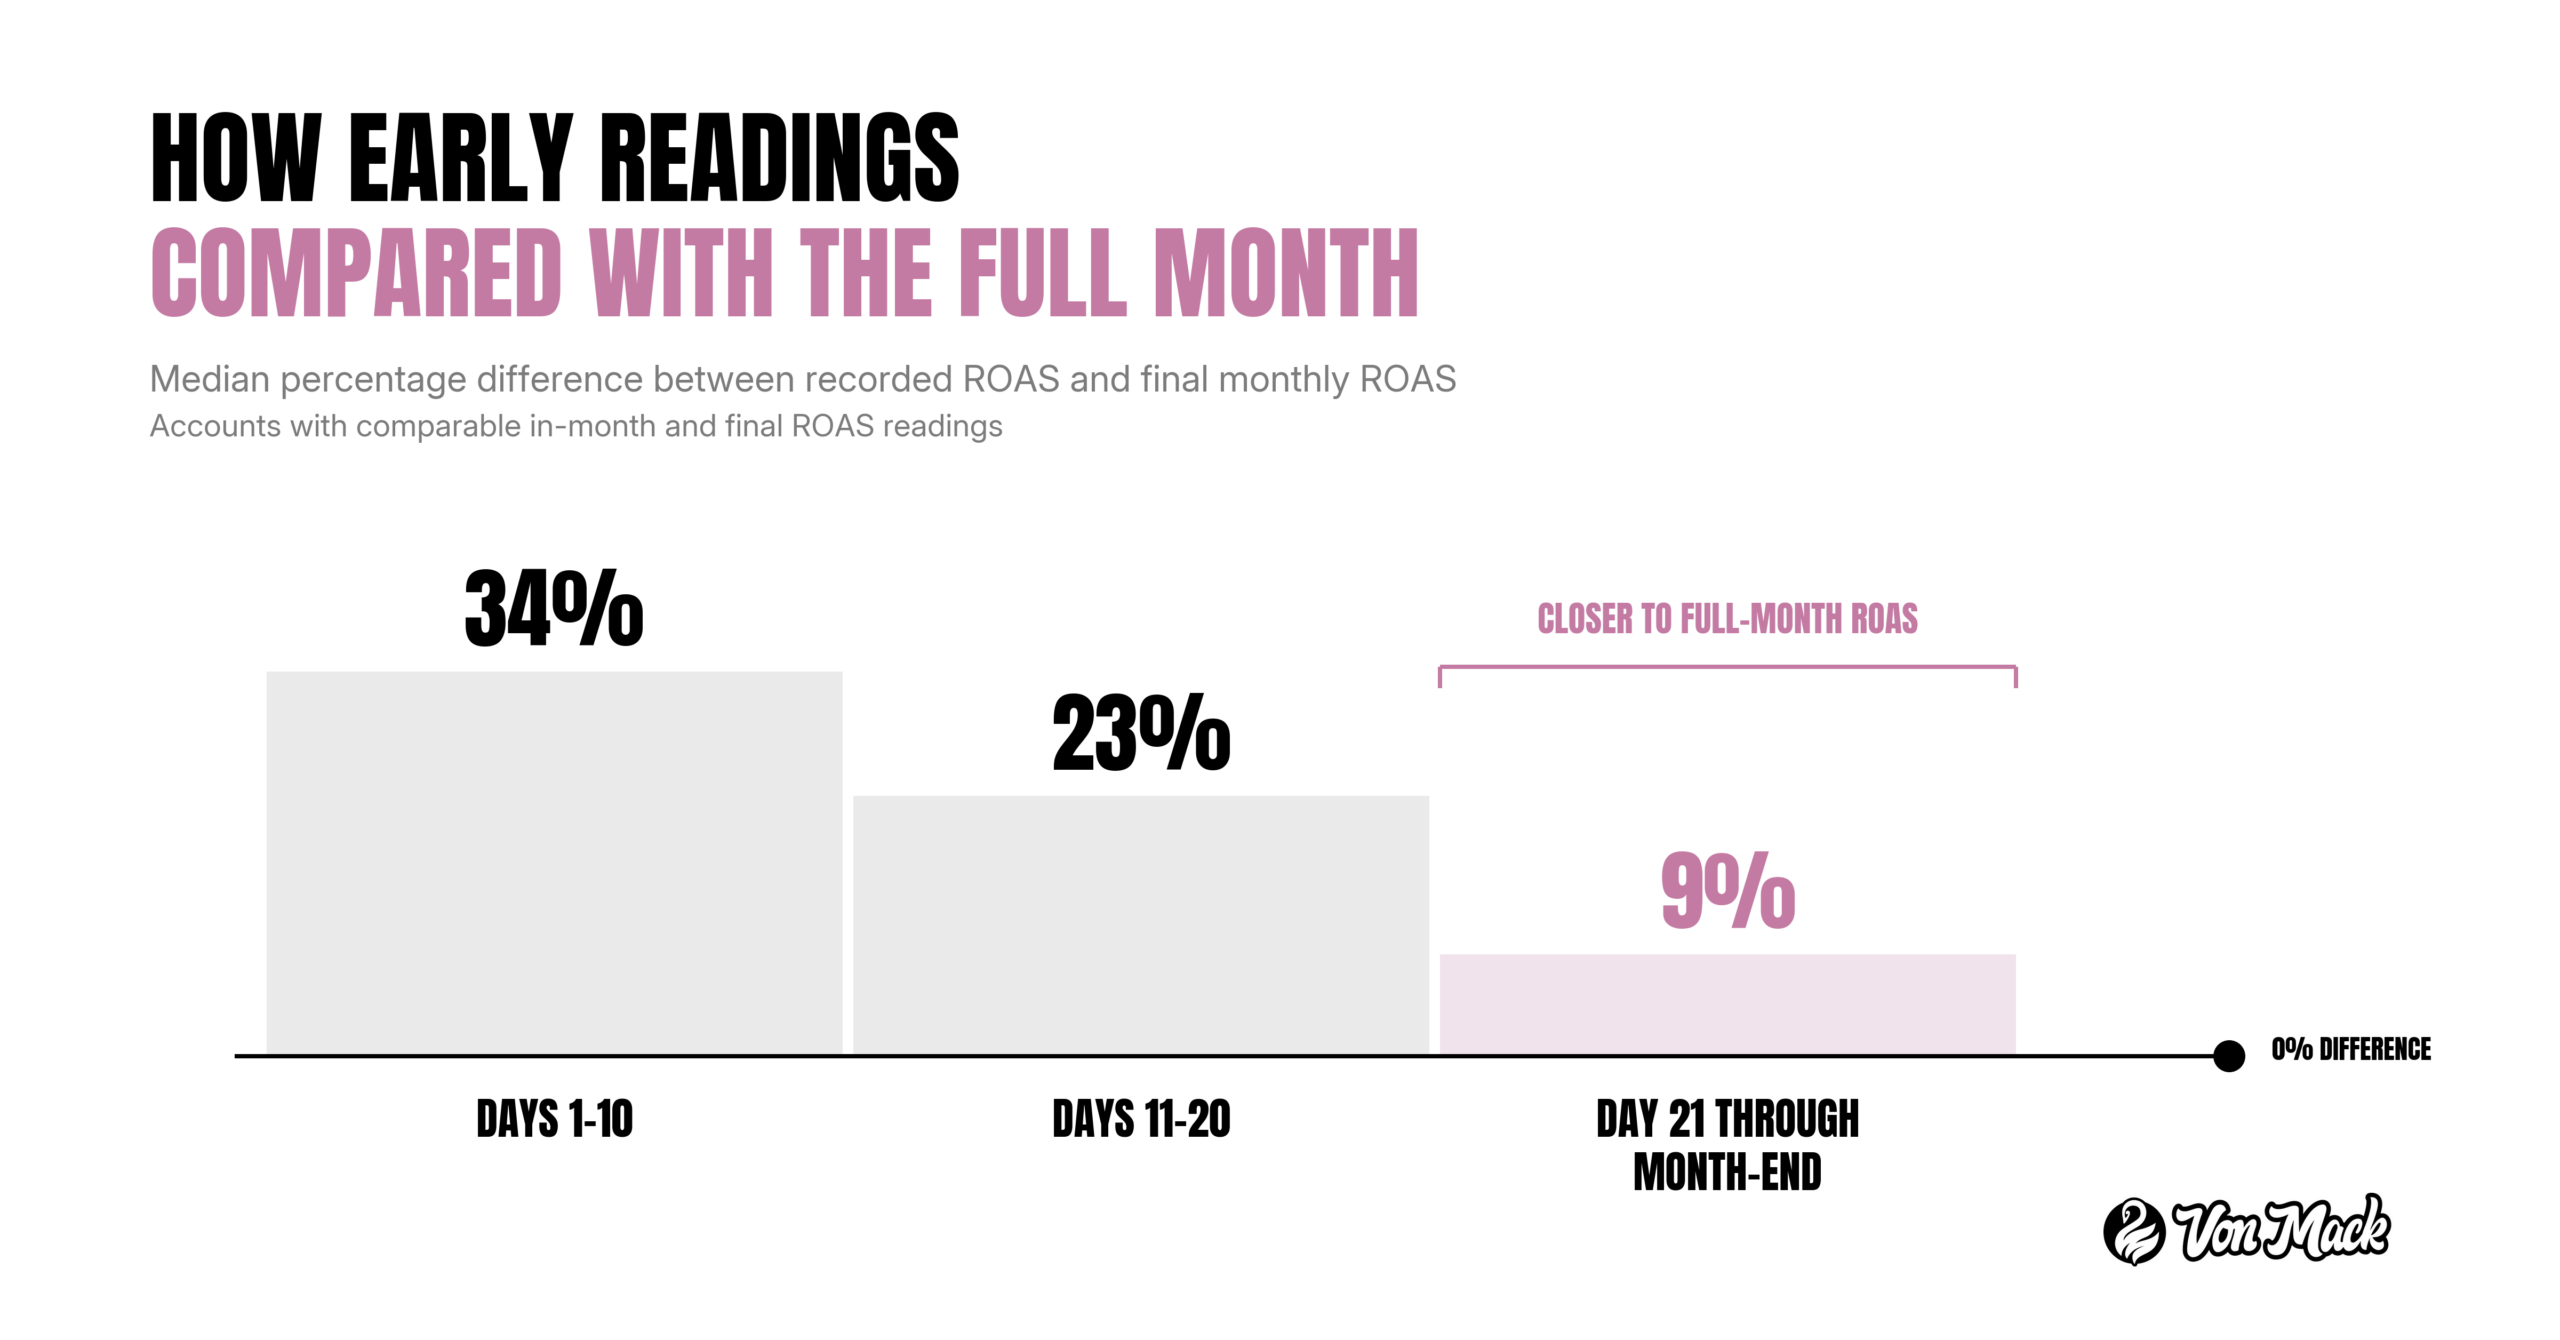
Our biggest tip in this case is to compare like with like. A week-one number gets checked against last month’s week one.
For example, our log is full of lines like “Compared to July 1 to 7, purchases are up 8%.” Early readings informed those decisions, while more complete data helped us assess the month as a whole.
7) What changed in September’s cost per booking?
We compared every campaign with steady bookings in June, July, and September. The September comparisons showed higher acquisition costs alongside lower revenue per booking.
In 83% of them, a September booking cost more than that campaign’s own June-to-July average.
The median increase was 38%.
Those bookings were also worth less.
Revenue per booking fell by a median of 12% in those campaigns. ROAS was also lower in 74% of the comparisons, with a median decline of 39%.
By August, the median cost per booking was already 31% above June to July.
Campaigns that spent at least 60% less in September than their June-to-July monthly average saw their median cost per booking rise 9%. Among the remaining campaigns, it rose 75%.
It’s important to remember that spending, demand, and availability can change together. The practical move is to review seasonal budgets alongside booking value, departure dates, and available capacity.
What this Means for Tourism Marketers
Tourism is not e-commerce with palm trees, you guys. A guest has to feel an experience before they buy it, fit it into a real day, and often talk it through with someone, sometimes a real person on the phone.
Campaign reports become more useful alongside the booking calendar, confirmed sales, and conversations with reservations. Together, they help show where to adjust.
So get closer to the numbers, and to the deeper workings of the business behind them. Know what actually sold, which sales the platforms credited, where a guest needed help, and which conclusions the evidence can’t support yet.
That’s the work we do at Von Mack. Our digital marketing team puts the numbers next to the booking reality, from the official booking path to the phone, then works out what the next strategic decision actually requires. Tourism is all we do. Moving it forward is why.
Put your campaign numbers next to the business you want to grow. Request a fit conversation with Von Mack and tell us your goals, what you’ve tried and what your reporting isn’t answering.
FAQs
In this study, July accounted for 37% of attributed revenue from June 1 to October 15, 2026. Results varied by tourism vertical. Individual planning should reflect the destination, booking window and departure calendar.
Among the available comparisons, readings from the first ten days differed from final monthly ROAS by a median 34%. The median difference narrowed to 9% from day 21 through month-end. Early readings informed ongoing decisions while the month was still developing.
In 83% of the campaigns compared, September’s cost per booking exceeded the campaign’s June-to-July average. The median increase was 38%. Revenue per booking also declined, making both acquisition cost and booking value relevant to spending decisions.
A strong ROAS can indicate an opportunity to grow. Additional spending should also reflect margins, available capacity and acquisition targets. In this study, spending increases accompanied higher combined revenue and often a lower ROAS.
Lower monthly spending was followed by higher ROAS in 55% of the June-to-September comparisons involving spending decreases of at least 10%. The decision to reduce spending also depends on demand, availability and client goals.
Google reported more attributed revenue in this study, while Meta had the higher blended ROAS. In matched comparisons for the same brand and month, Meta led more often in June and July, while Google led more often from August through October 15.
Attractions had the highest blended ROAS among the verticals reviewed, at approximately 8.0x. Booking values, sales processes and the use of estimated inquiry values differed across verticals.
Connect with The Von Mack Agency today.
We’re ready to join you in building travel and tourism marketing that moves with culture, clarity, and purpose.