

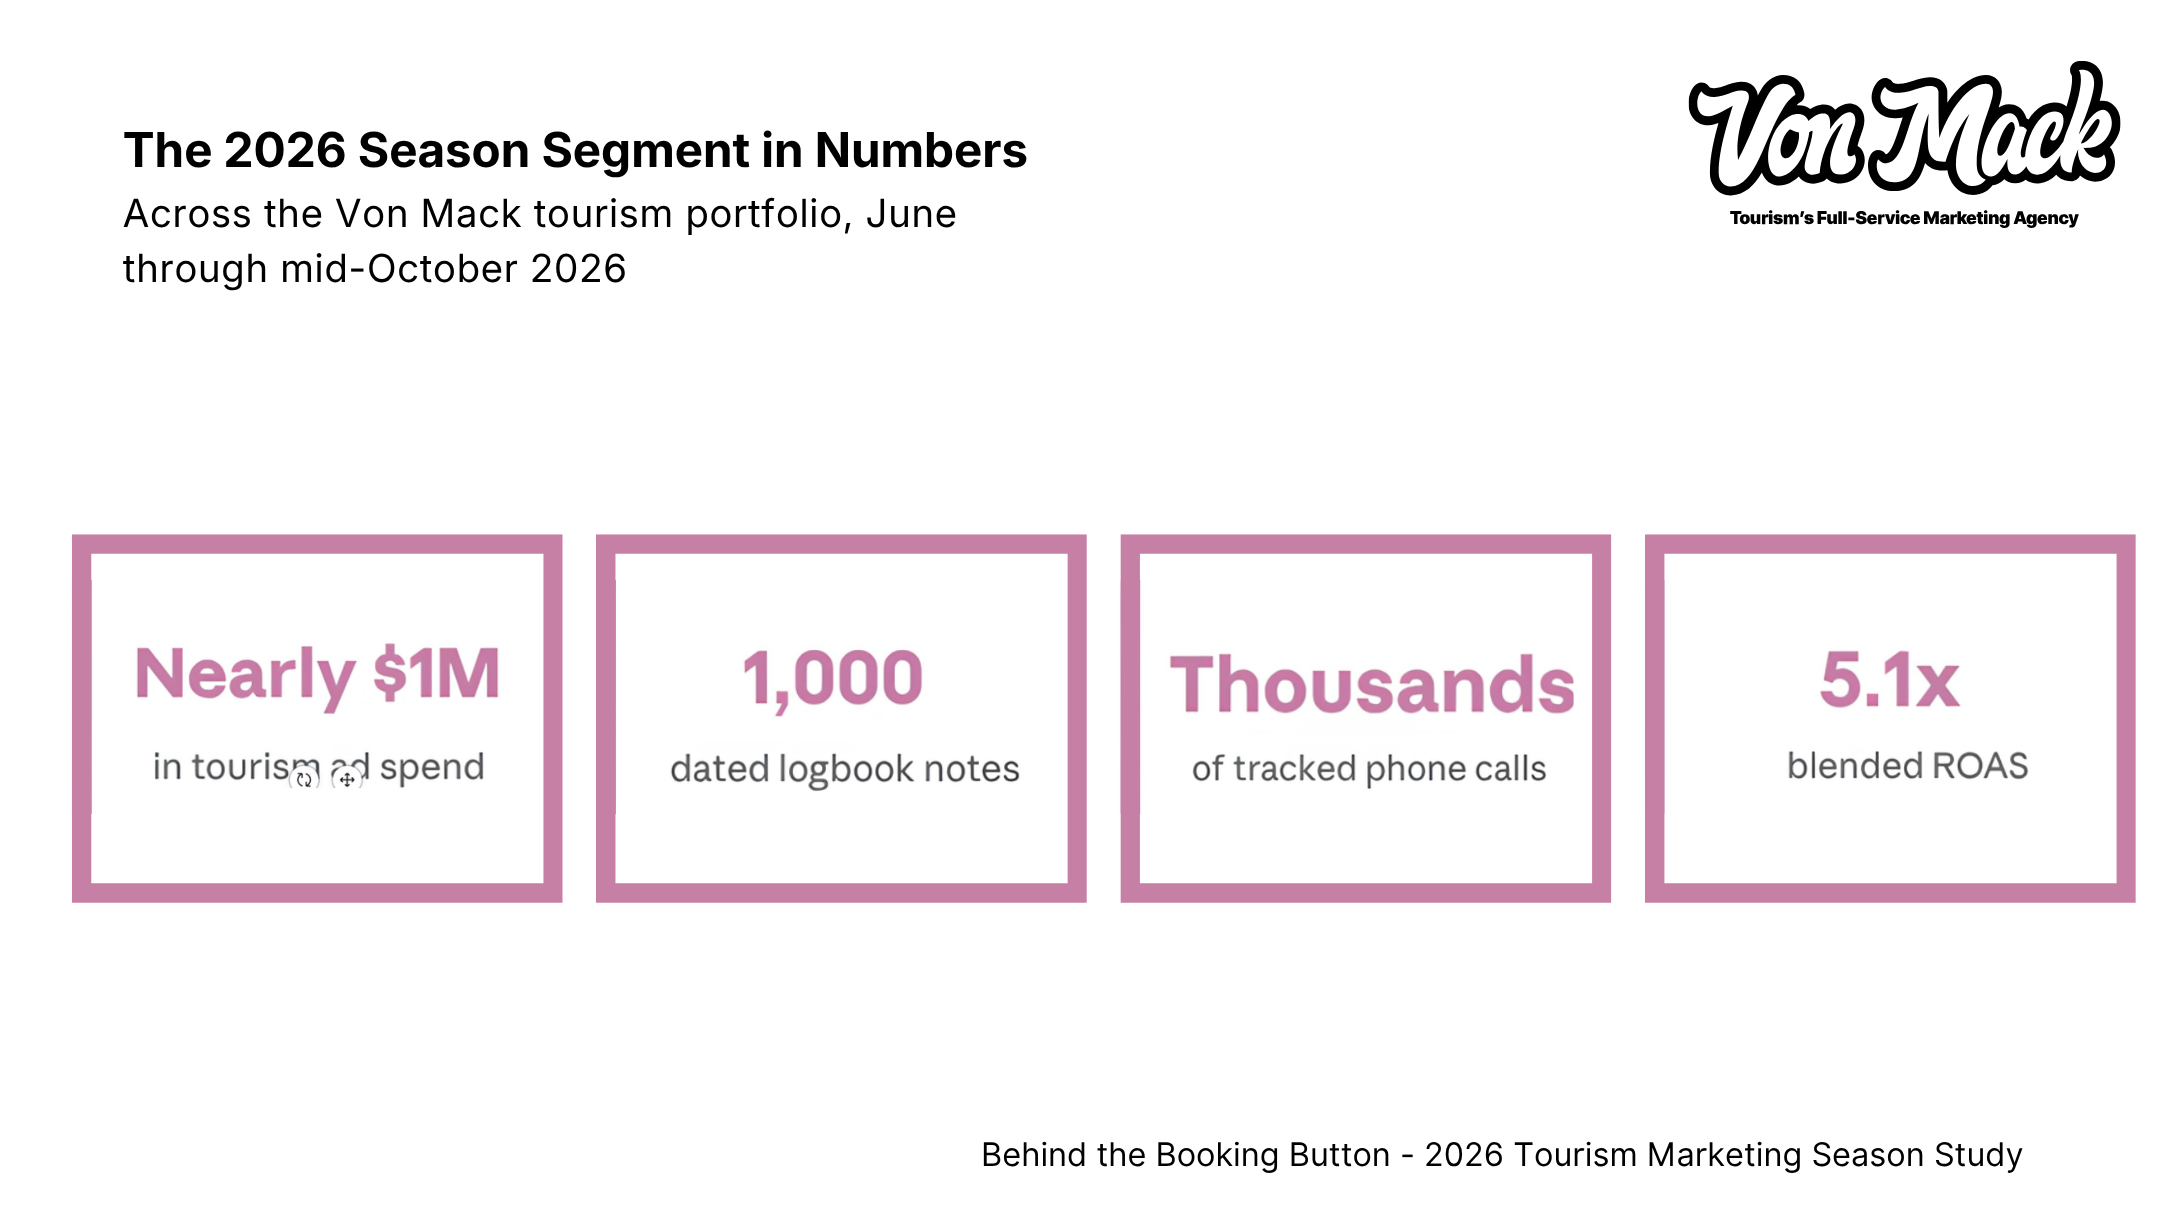
A special look under the hood at The Von Mack Agency's campaigns over the summer of 2026. Expect a qualitative analysis of what happens in a paid campaigns season when you factor in client collaboration, Von Mack know-how, integrated strategy, and real spend.
~ $1 Million in Ad Spend + 1,000 Human-Written Optimization Logs + 3.5 Months
A note on privacy: Every figure here is aggregated across our portfolio. No individual client, location, product, or campaign is identified.
Your tourism marketing report is telling the truth. Just not all of it.
Picture a guest deciding what to do on vacation. They see an ad, click through, and don’t complete an online purchase.
The campaign report records that last part beautifully.
What the report can’t tell us is whether the time didn’t fit their itinerary, whether that person needed the rest of the group to agree, or whether they picked up the phone and booked that way instead.
We call that distance the Booking Reality Gap: the space between what an ad report records and what actually happened on the way to a booking.
That gap matters more every year. In Sojern’s 2026 survey of more than 350 destination marketing organizations, 72% named conversion and ROI metrics as key performance measures. When everyone from a single tour to an entire destination is judged on bookings, knowing what the report misses becomes a real advantage.
This season, we tried to see that gap from the other side. Our team keeps a working logbook on every campaign we run, and this season. We analyzed what those notes were about, week by week, across our whole portfolio, then set them beside nearly $1 million in campaign data. The result is part season log, part reality check on our own instincts.
So what do we do with the apparent lost sale? Rewrite the ad? Lower the price? Cut the budget?
Maybe. But first, we should make sure we know which problem we’re solving. Sometimes the number itself isn’t even settled yet: in our data, ROAS readings taken in the first ten days of a month missed the final figure by more than 10% about three times out of four.
Key findings at a glance
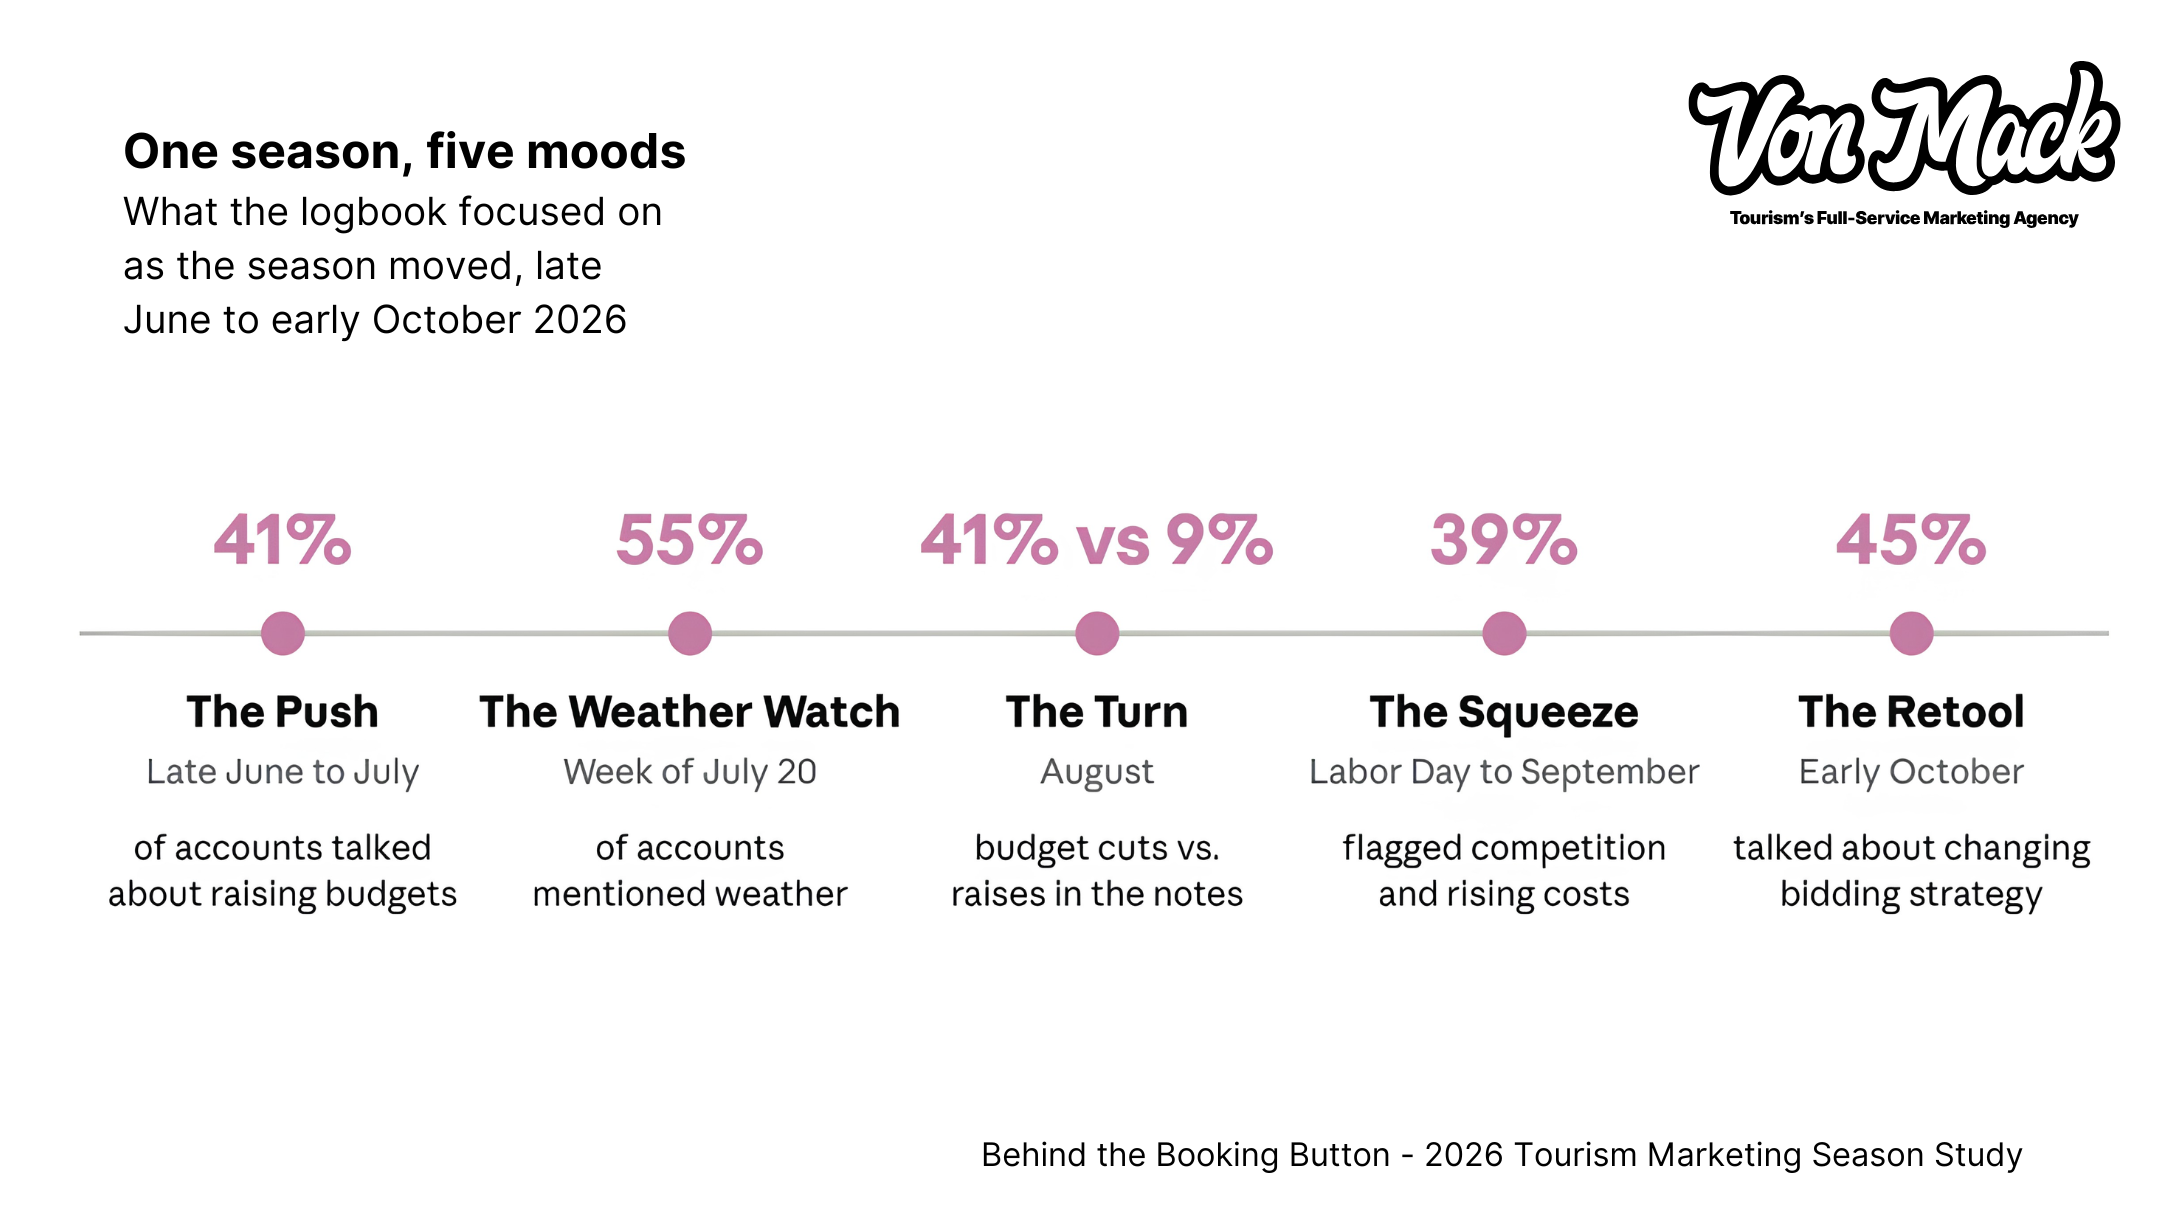
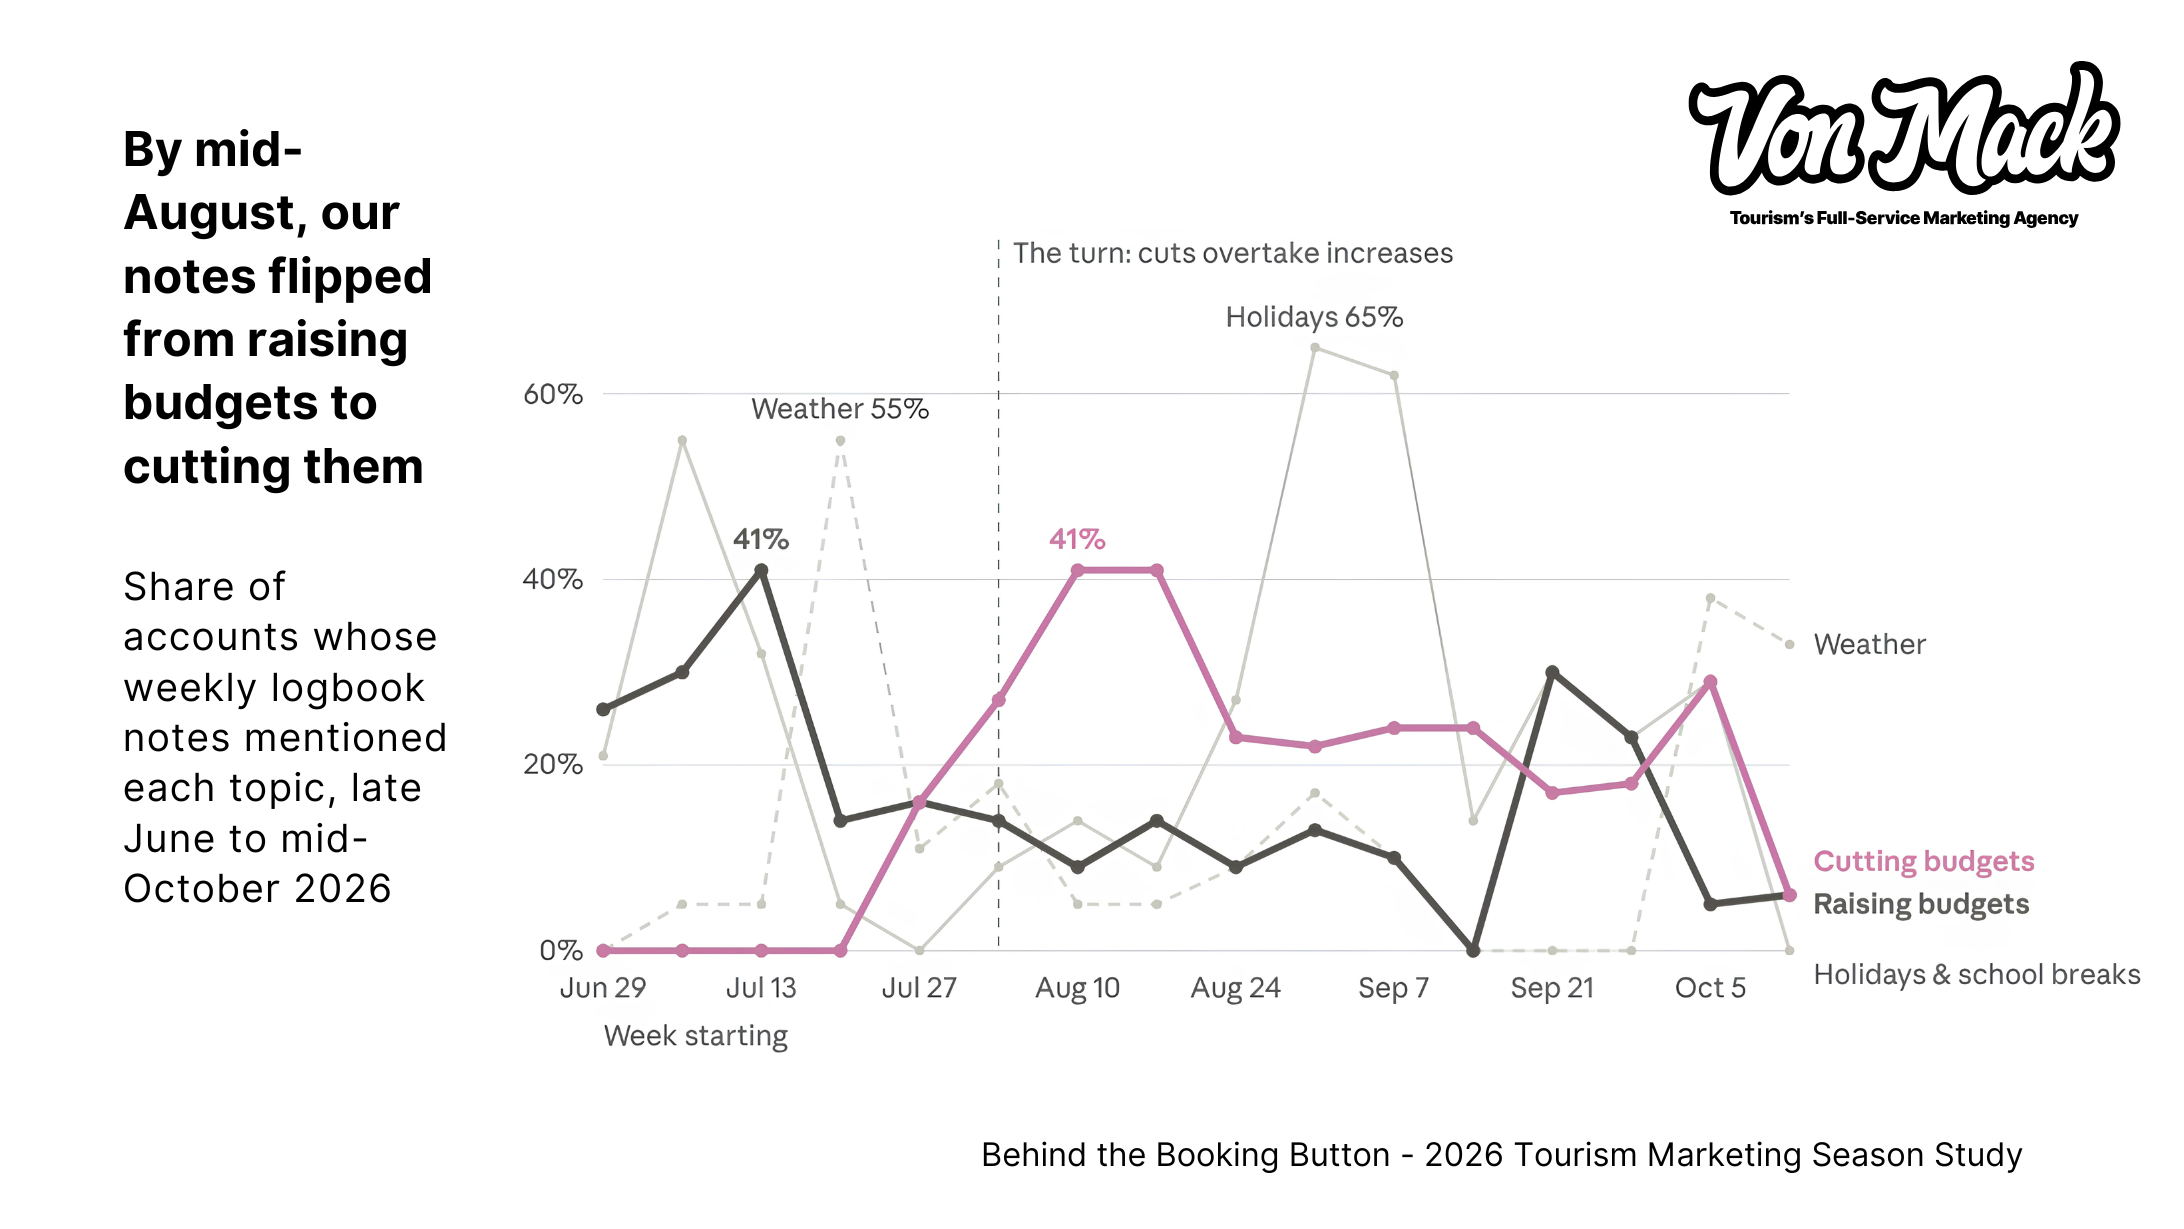
The logbook’s biggest story: in mid-July, notes on 41% of accounts talked about raising budgets and none talked about cutting. By mid-August, cuts outpaced increases. Here’s what the numbers said about moments like that.
- Your best customers may never book online. Experiences averaging $300 or more drew about 63 calls per 100 online bookings, nearly five times the rate of those under $300.
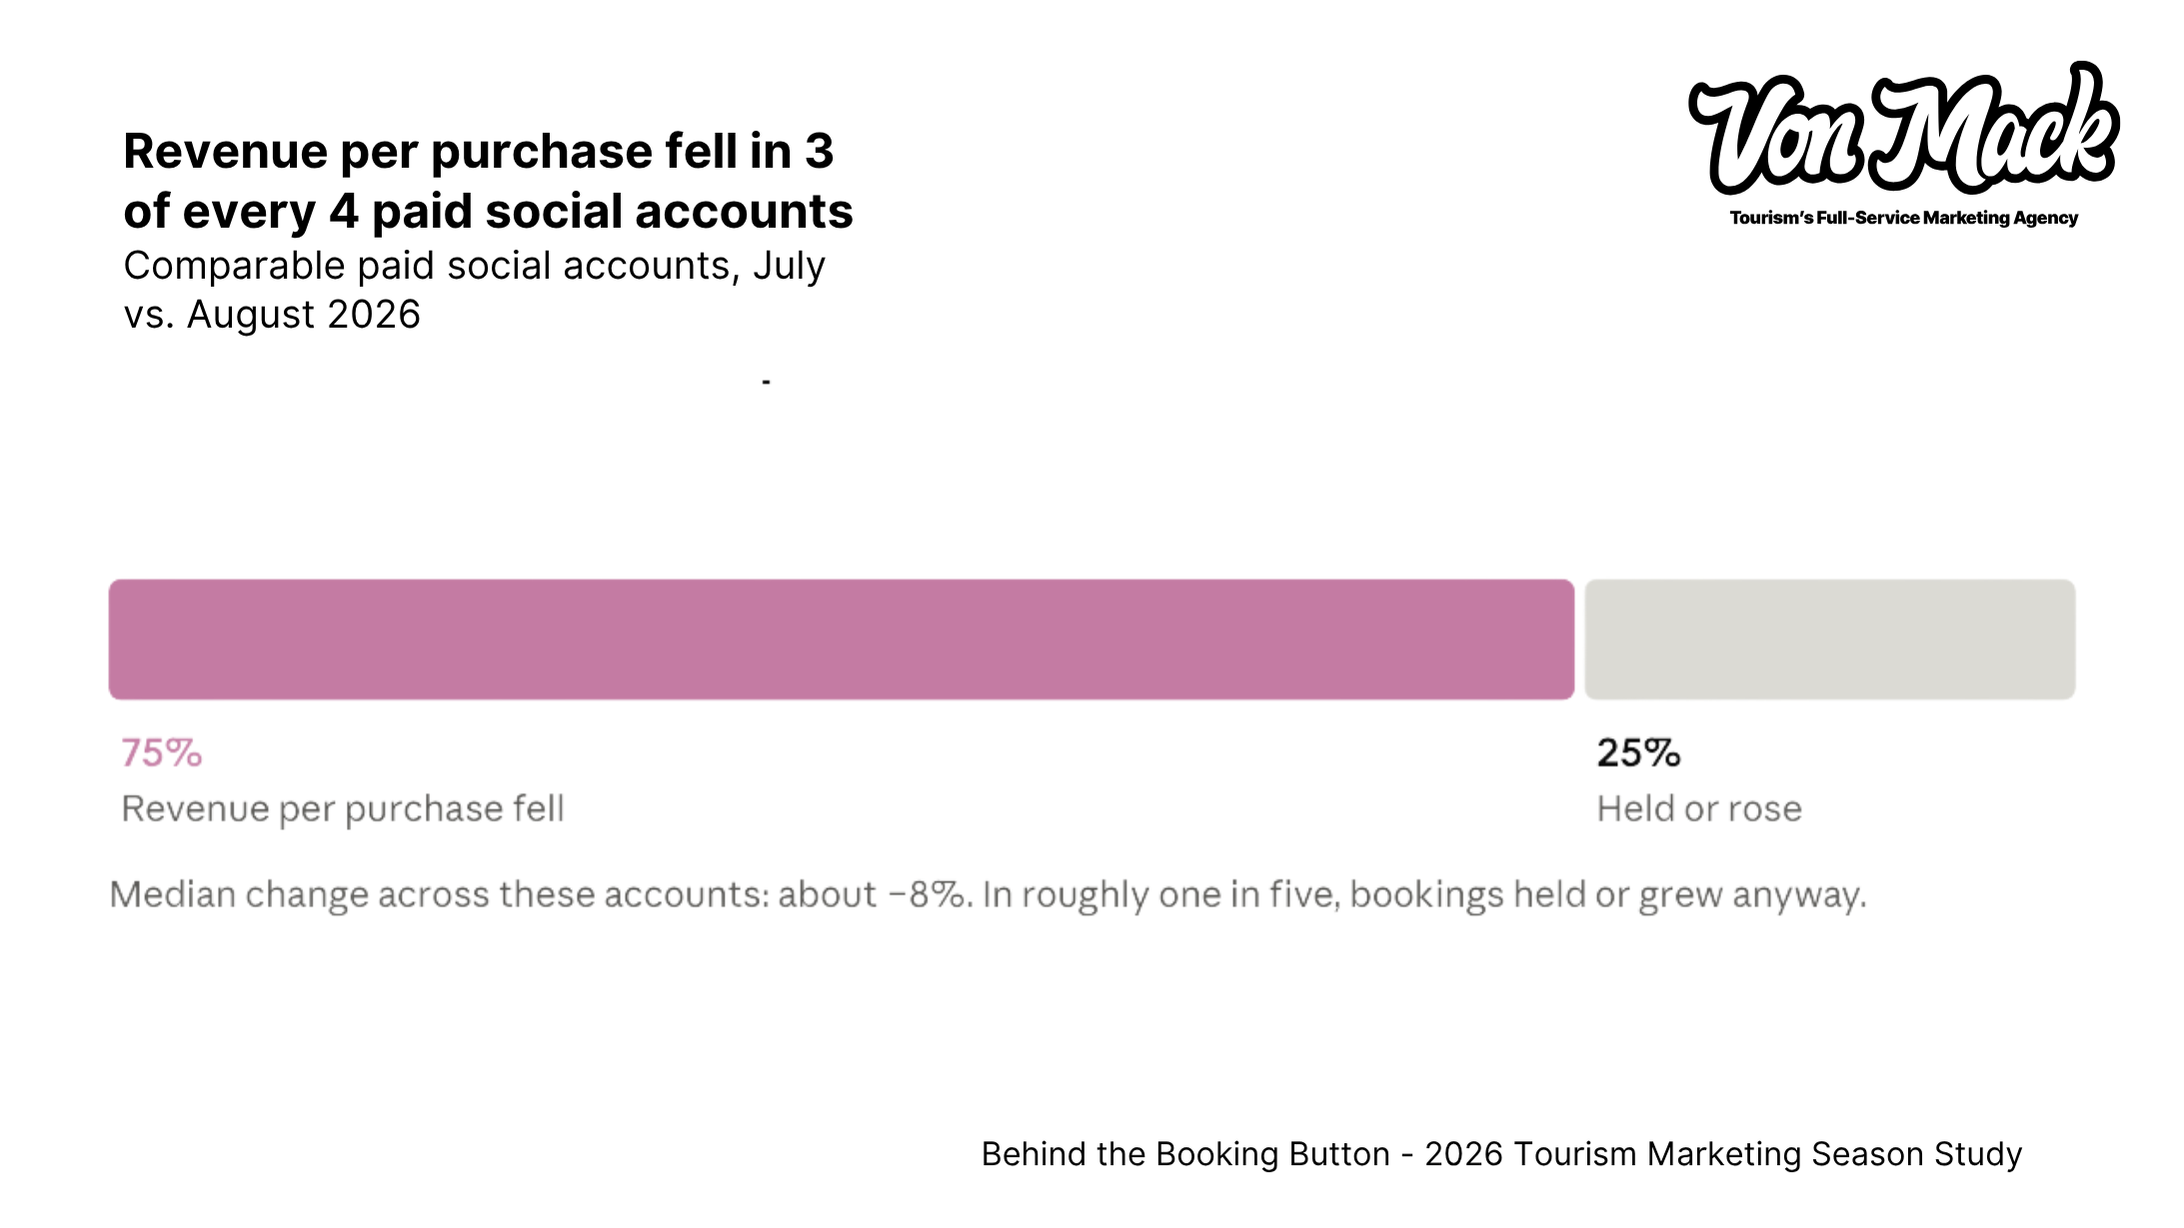
- Revenue can drop while bookings hold. From July to August, revenue per purchase fell in 75% of comparable paid social accounts, by a median of about 8%. In some, bookings held steady or grew anyway.
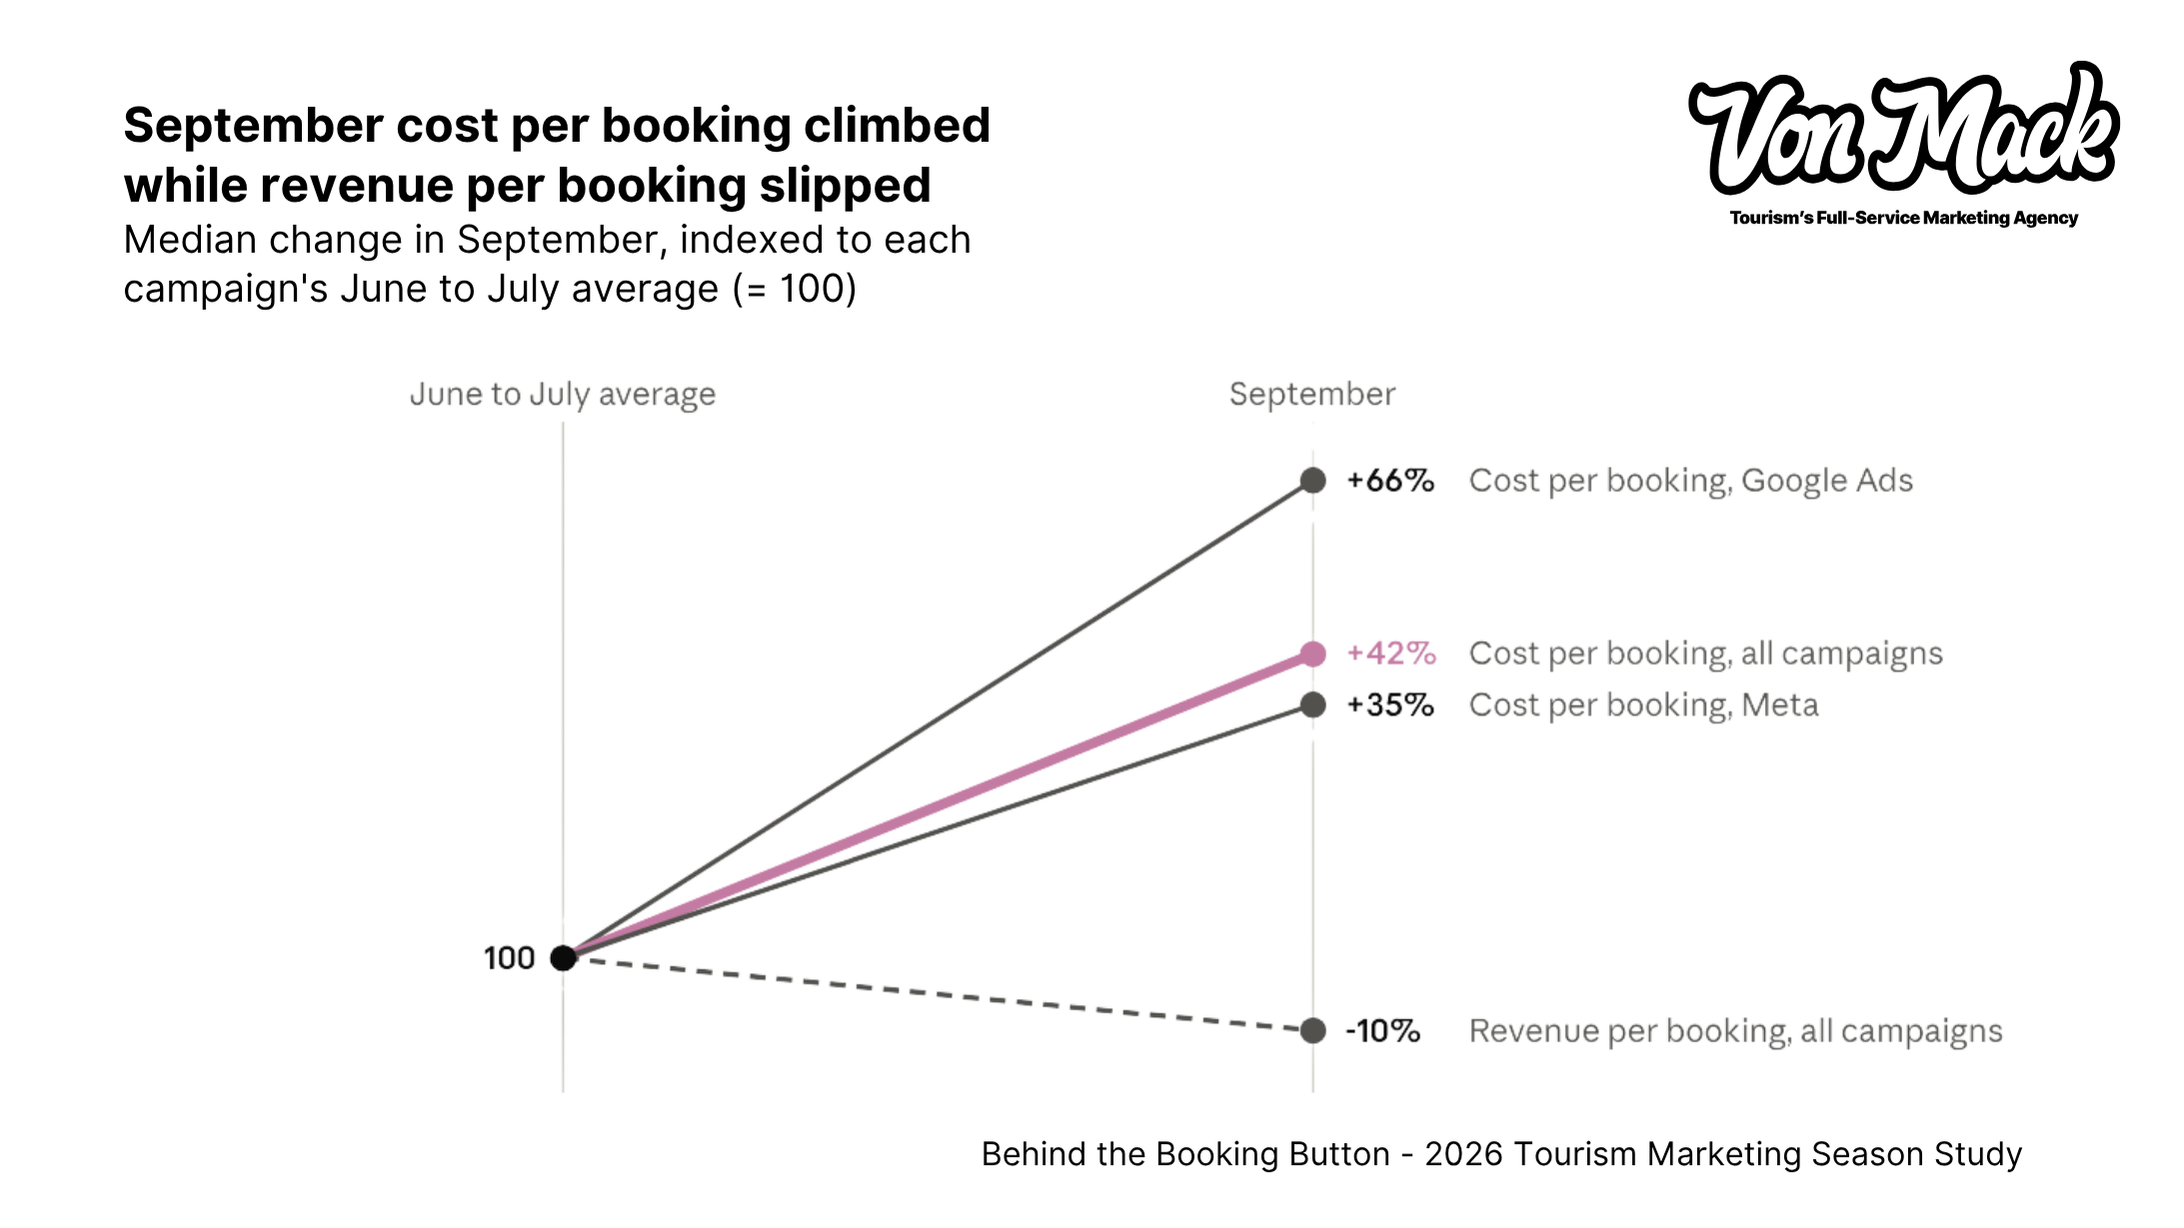
- The off-season costs more for experiences. In September, cost per booking rose above the summer average in more than 80% of campaigns, by a median of 42%. Guests didn’t spend more to make up for it.
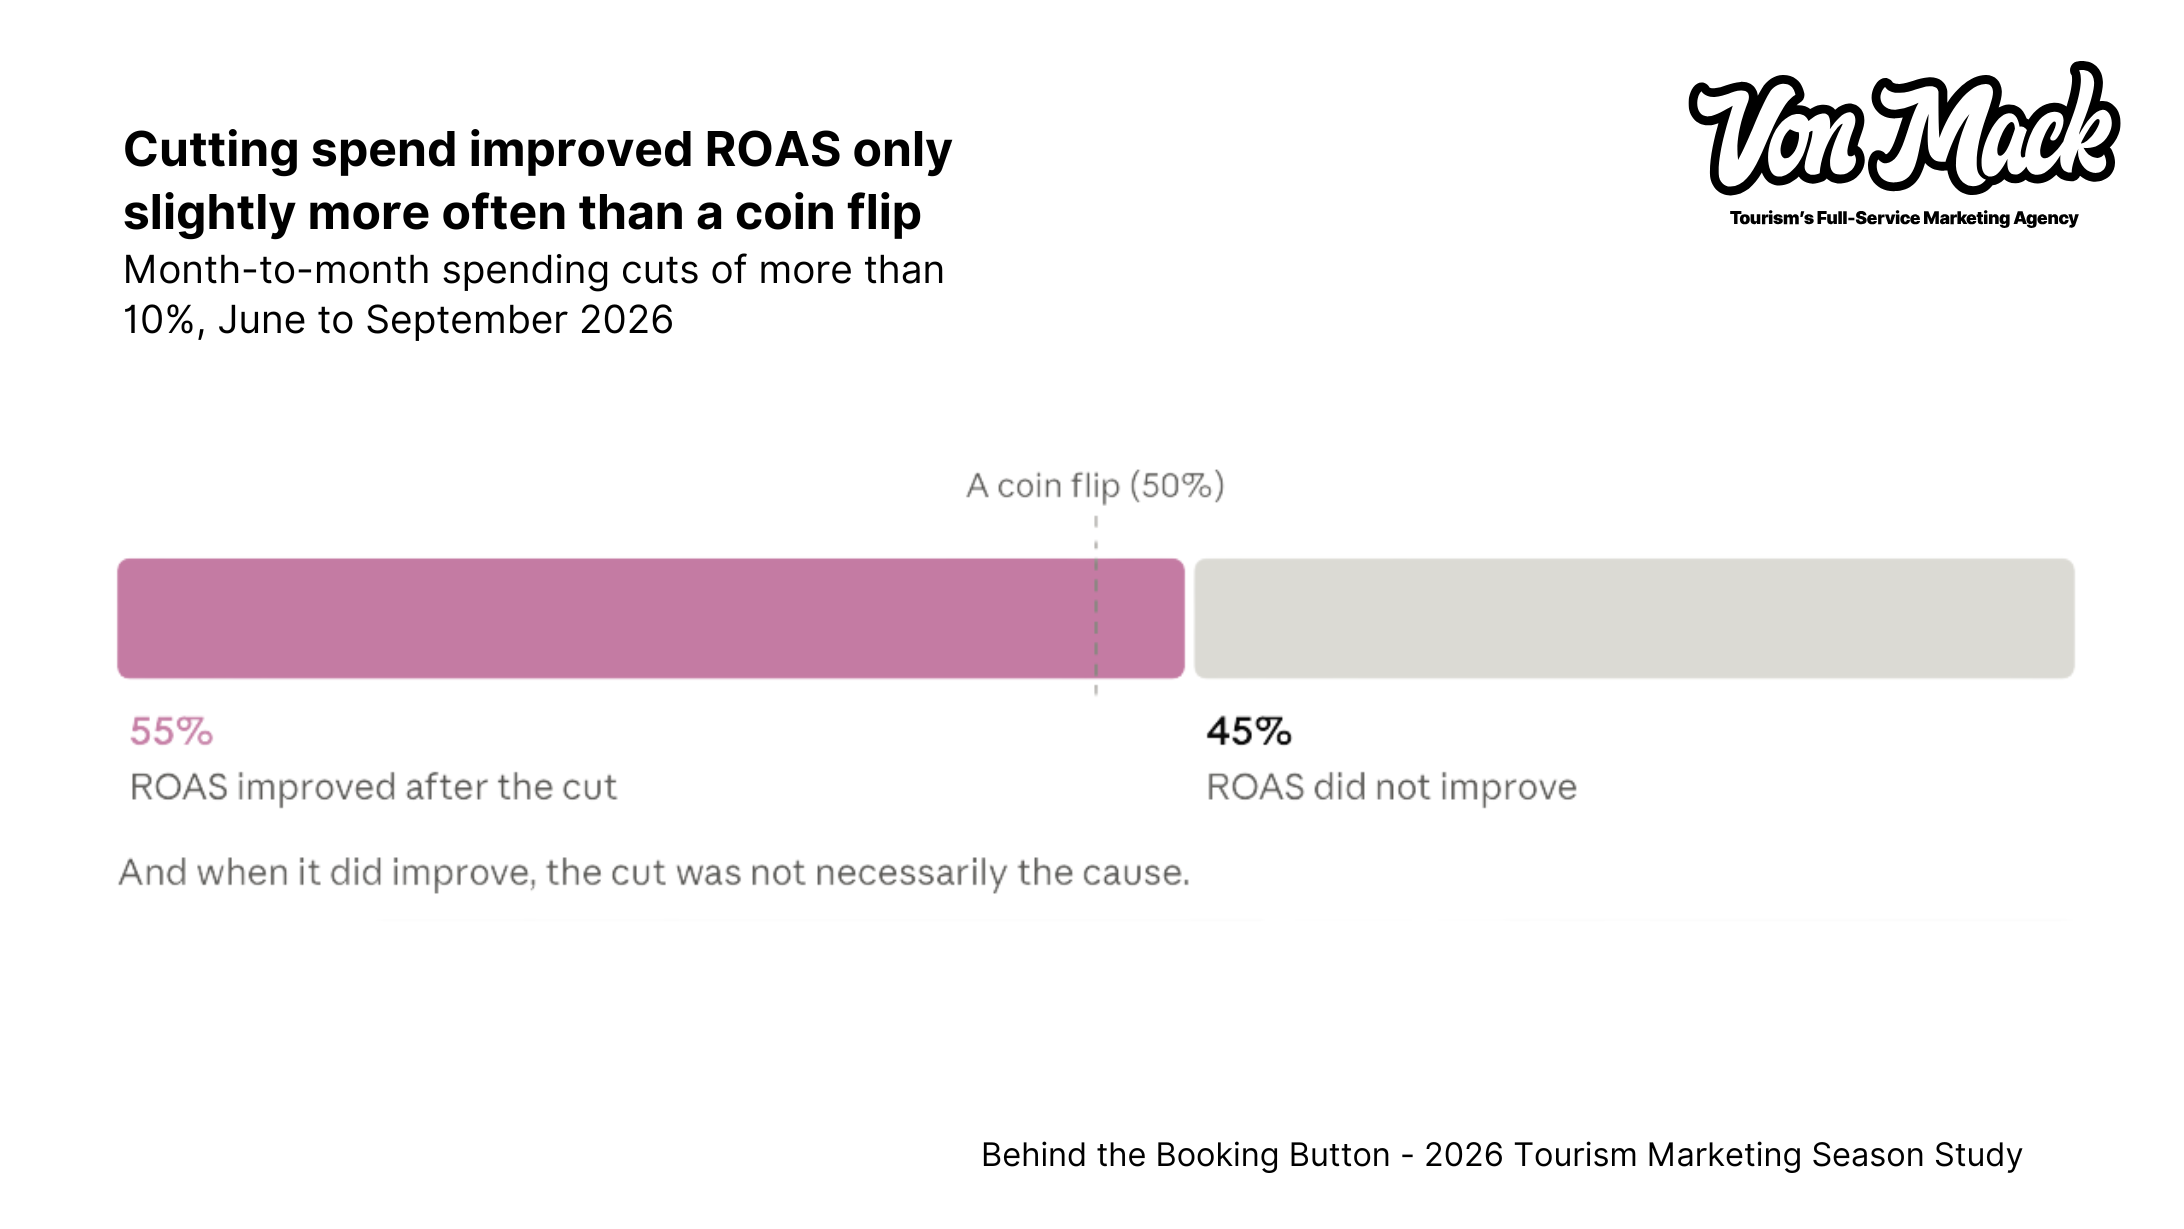
- Cutting spend rarely fixes ROAS on its own. ROAS improved after a spending cut of more than 10% only 55% of the time.
- Early-month numbers aren’t reliable. About three in four ROAS readings from the first ten days of a month missed the final figure by more than 10%.
The season, week by week
Late June – July: The Push
Week of July 20: The Weather Watch
August: The Turn
Labor Day to September: The Squeeze
Labor Day week was the busiest week in the logbook.
Holidays came up on 65% of accounts and weekends on 61%. Mentions of competition and rising costs jumped to 39%, the highest of the season, and tracking questions peaked at 30%.
That pressure shows up in the numbers as the off-season cost premium.
By late September, as Fall Break showed up in the notes, budget increases came back, mentioned on as many as 30% of accounts.
Early October: The Retool
As September turned into October, the logbook shifted from spending to rebuilding.
In the week of September 28, changes to bidding strategy came up on 45% of accounts, more than four times the season’s weekly average and the highest of the season. Notes about rebuilding, restructuring, or retargeting hit 32%, also a season high, and nearly one in four accounts were talking about winter and the slower months ahead. This is the kind of quiet work that decides how next season starts.
Finding #1: Why do tourists call instead of booking online?
The sale may be happening outside the neat little box we call “online purchase.”
An experience asks more of a buyer than a product on a shelf. Guests are committing money, vacation time, and often the plans of everyone coming with them, so their expectations during the booking journey are high. And many experiences are still sold offline: 2026 research from Arival and Phocuswright found that fewer than half of travelers booked their most recent tour, activity, or attraction online, and nearly one in five simply walked up. When a decision gets complicated, people want a person: in Invoca’s 2025 survey of buyers making complex, high-value purchases, including travel, 67% said they prefer to speak with someone.
The accounts with call tracking in our study logged thousands of calls from ads between June and September. And the pricier the experience, the more people called. Experiences averaging under $300 per booking drew about 13 calls for every 100 online bookings. Experiences averaging $300 or more drew about 63 for every 100, nearly five times as many.
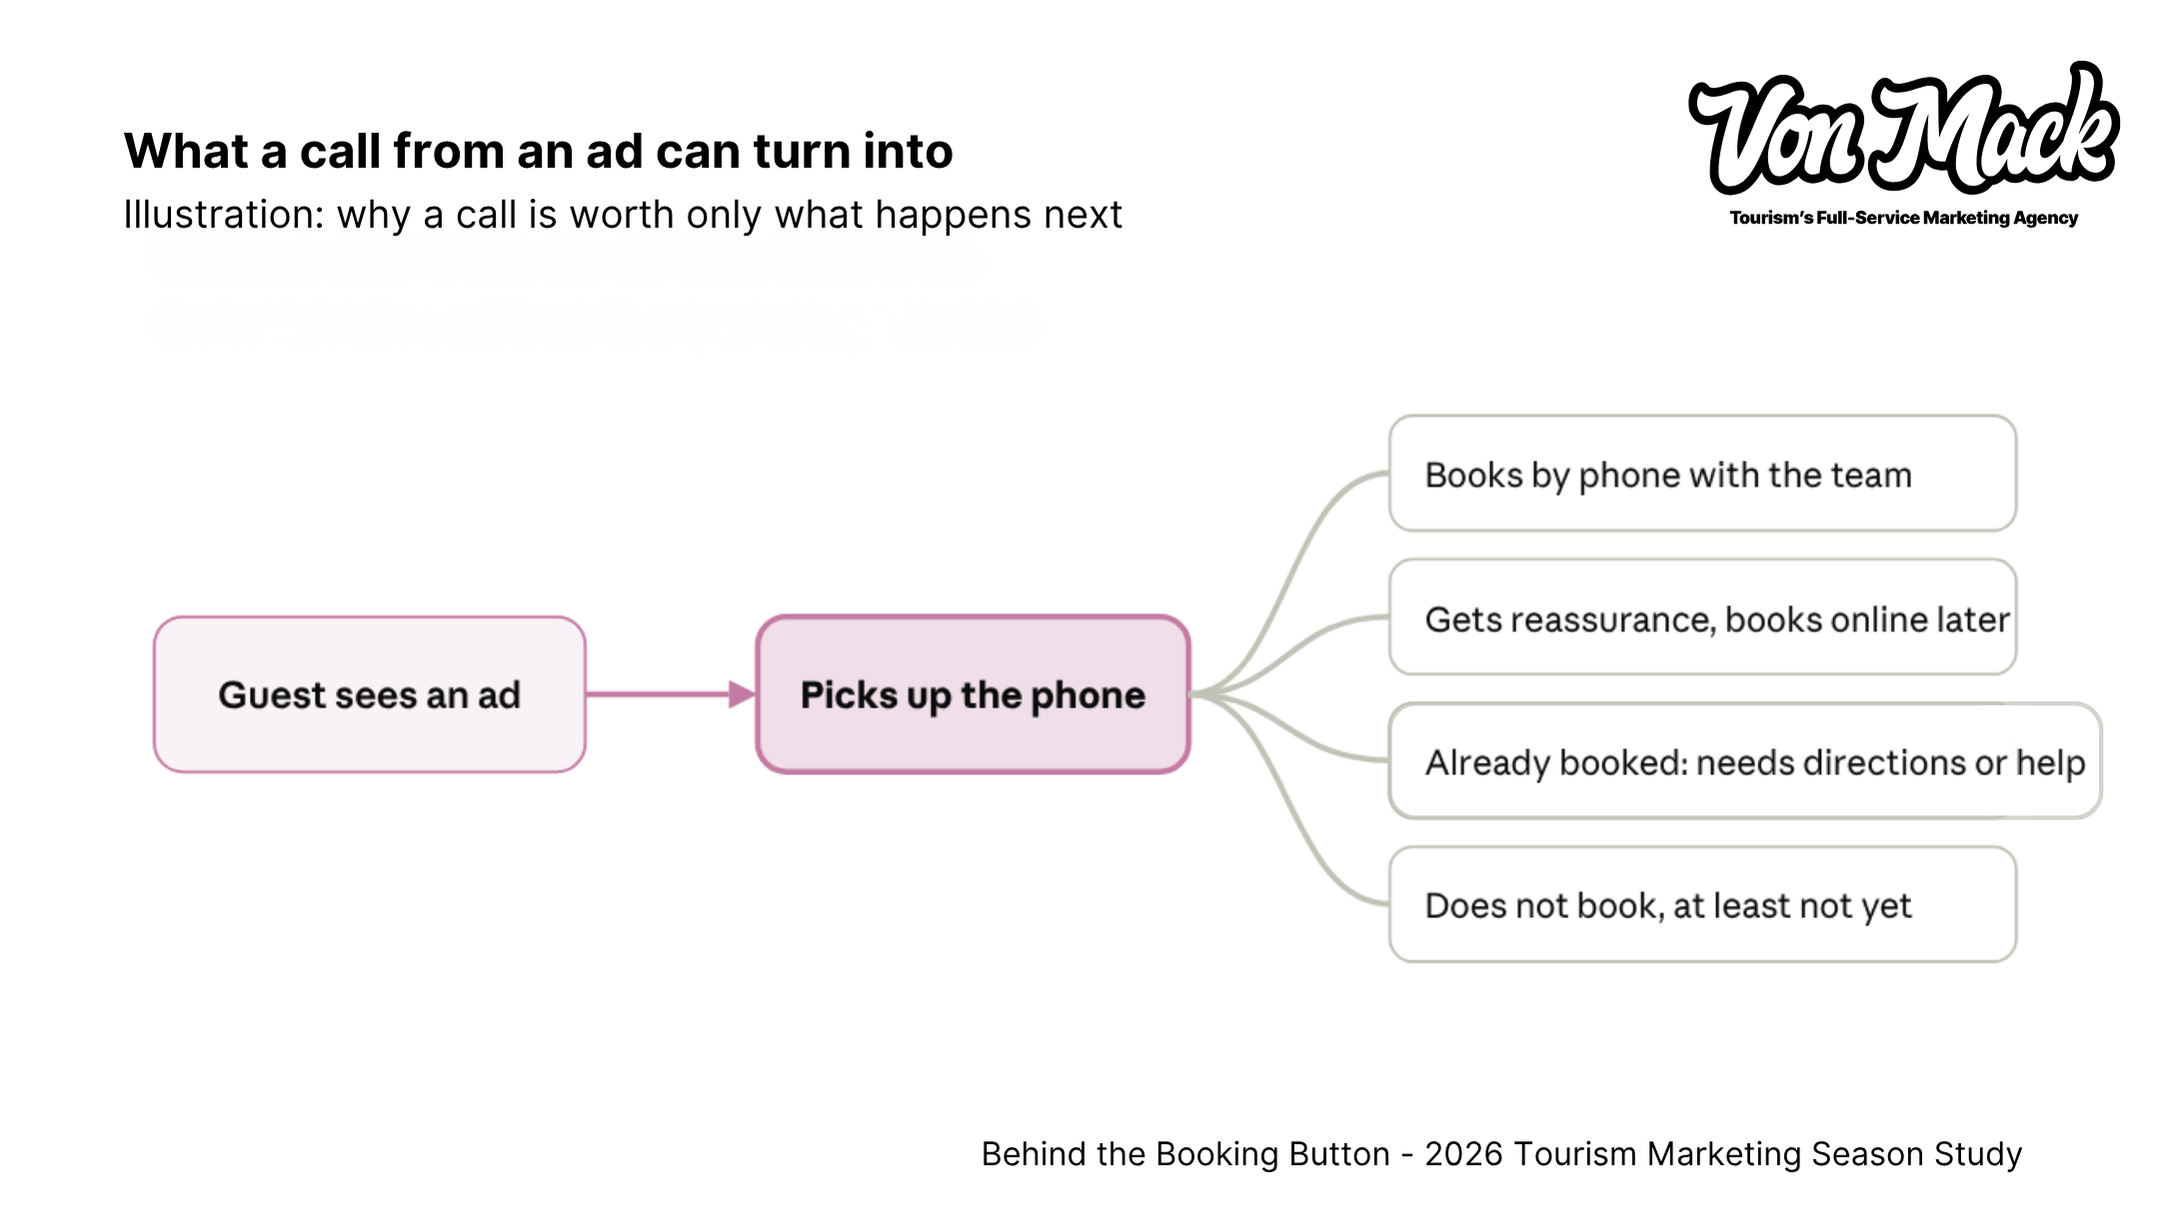
In the logbook: Phone calls came up in the notes on 41% of accounts by mid-July, the height of the season.
That’s why travel business owners and CEOs should stay close to what happens on the phone. A quick tip is to ask your team, “What were people trying to resolve when they called, and what happened next?” The answer tells us whether the opportunity is in the ad, the product page, the booking path, or even the experience itself.
Our takeaway? Before assigning a value to calls, find out whether they’re pre-purchase questions, completed phone bookings, later online bookings, or post-purchase service calls.
Finding #2: Why does revenue per booking drop when bookings don't?
The guest may want the experience, but the available booking may not fit.
Tourism marketers are used to asking whether the message matched the audience. We should also ask whether the purchase matched the moment.
Someone looking for a plan for tomorrow may love an experience and still be unable to organize a private group. A family may want the longer tour but have only half a day free. Group decisions can be harder than individual ones because each person brings different constraints. The guest can be interested, qualified, and counted as a click without having a realistic path to the booking in front of them. Industry research backs this up: Arival’s 2025 Tour Taker Report found that 70% of U.S. travelers booked tours less than seven days in advance, and 69% chose tours of three hours or less. Guests are fitting experiences into tight, often last-minute plans.
Our campaign numbers gave us a second reason to look beyond purchase counts.
Across comparable paid social accounts in our study, average attributed revenue per purchase fell from July to August in 75% of them, by a median of about 8%. In most of those accounts, bookings fell too, as you’d expect when summer winds down.
But in roughly one in five accounts, bookings held steady or grew while revenue per purchase dropped.
The guests kept coming. They just weren’t buying the same thing.
Travelers are stacking more experiences into each trip while spending per person stays flat, protecting how many experiences they get rather than trading up, which is the same pressure we explored in our look at inflation and travel spending.
That’s the pattern a purchase count hides.
If revenue feels softer while bookings look steady, more traffic may not be the first fix.
Start with the booking records, and push for more detailed tracking. Find out what sold, what was available, and whether the offer matched the decision the guest was ready to make. And remember, when clicks and bookings seem healthy but revenue feels softer, ask what was purchased before asking for more traffic.
In the logbook: By mid-August, notes about cutting budgets outnumbered notes about raising them, right as revenue per booking began to soften.
Finding #3: Is the off-season really cheaper to advertise in?
For experiences, the shoulder season costs more, not less.
It’s a common belief that ads get cheaper once the crowds thin out. And for trips planned months ahead, that can be true.
But our data points another direction when it comes to experiences that guests book days before they go.
In September, cost per booking rose above the June – July average in more than 80% of our campaigns, by a median of 42%. On Google Ads, the median increase was 66%.
And guests didn’t spend more to make up for it! Revenue per booking fell in most campaigns, by a median of about 10%.
The shoulder season isn’t a smooth slope, either.
Our logs indicate short bursts of demand right around Labor Day and Fall Break. These are the types of windows worth planning budget around, rather than spreading spend evenly or pulling it all at once.
This applies to destinations as much as operators. Destinations can chisel at their own seasonality in this way, using events and school-break promotions among the levers to pull. In our notes, they’re also where shoulder-season demand concentrated.
Takeaway? Plan shoulder-season budgets around cost per booking and known demand bursts. Last summer’s ROAS is not a shoulder-season strategy.
In the logbook: Over Labor Day week, mentions of competition and rising costs reached 39% of accounts, the highest of the season.
Finding #4: Should you cut ad spend when ROAS drops?
A budget change is not a diagnosis.
When efficiency drops, cutting spend feels disciplined, and nobody wants to keep feeding a campaign that looks unhappy. Sometimes it’s the right move, but not as often as you’d think.
In our analysis, we looked at every month-to-month change where a campaign’s spend fell by more than 10%. ROAS improved afterward only 55% of the time. That’s barely better than a coin flip!
And even in those cases, the cut didn’t necessarily cause the improvement.
Budgets are often reduced precisely because demand or performance is already shifting. A big cut can even backfire. Take Meta, for instance, where a budget change of more than about 20% in a day can send a campaign back into its learning phase, when performance is typically less stable.
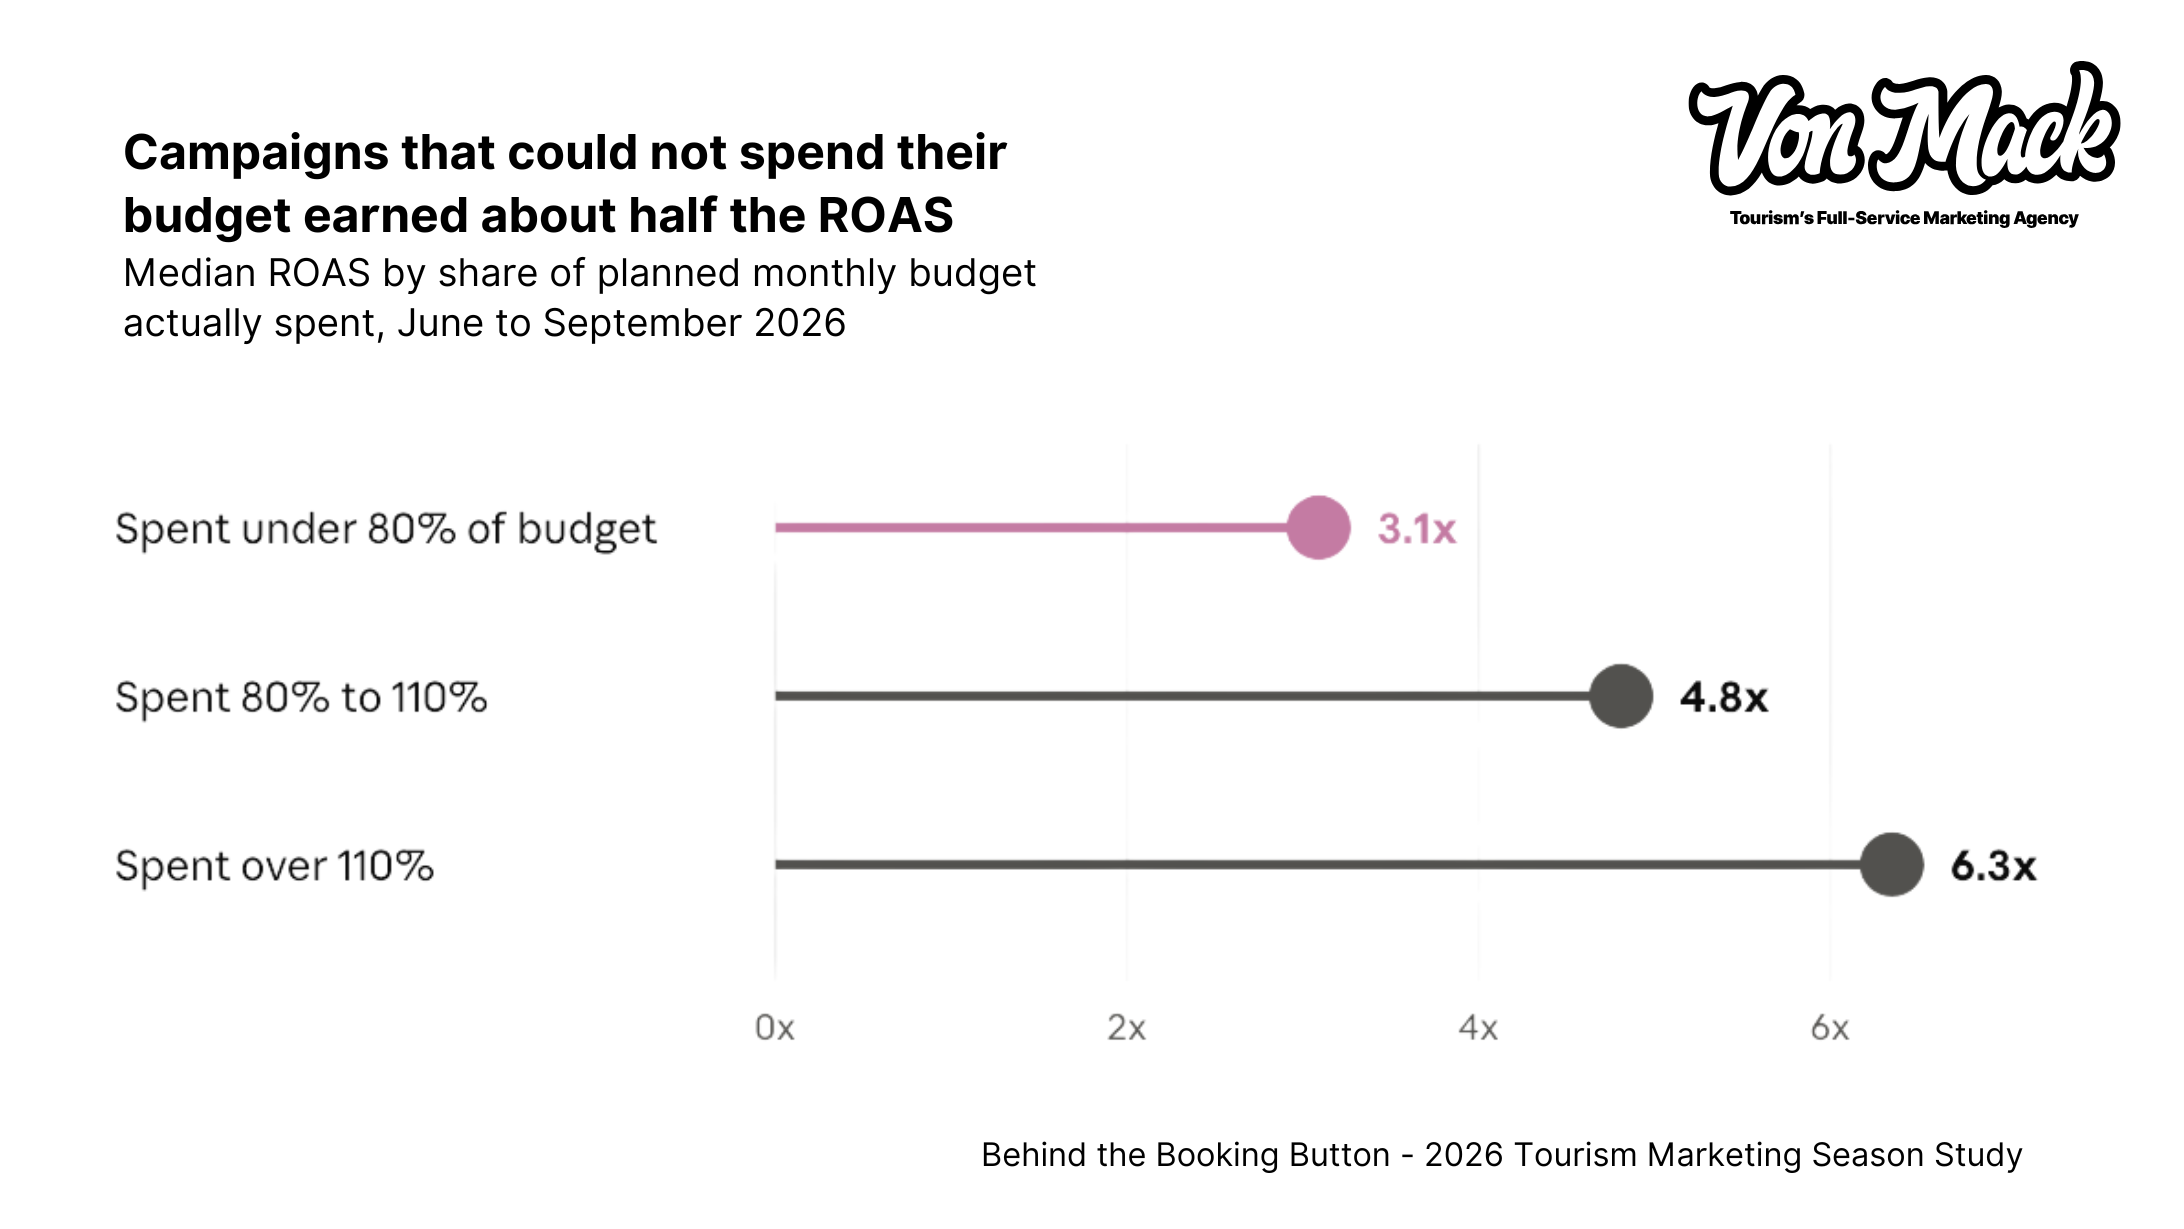
To be clear, overspending doesn’t automatically create a healthy campaign, so hold off on throwing money at campaigns without the data to back it. Part of what drives this pattern is that we add budget where demand is already strong. But more budget also gives the platforms more data to learn and optimize from, and there’s generally a minimum number of conversions needed for a campaign to exit the learning phase.
A campaign that can’t spend for whatever reason can be a serious issue.
A non-spending campaign is often telling you the platform is struggling to find enough qualified buyers. To a seasoned marketer, an unspent budget is a signal to investigate, not a reason to spend harder.
In the logbook: In mid-July, notes on 41% of accounts talked about raising budgets and none about cutting. Four weeks later, cuts led by more than four to one.
Finding #5: How long until ad results are reliable?
Ok, so pixeldust is real.
Pixeldust is what our team at Von Mack calls the early, unsettled numbers that float around a campaign before the data lands.
Conversions keep trickling in after the click. Google’s own guidance notes that conversions can be reported up to 90 days later, so recent performance can look weaker than it really is.
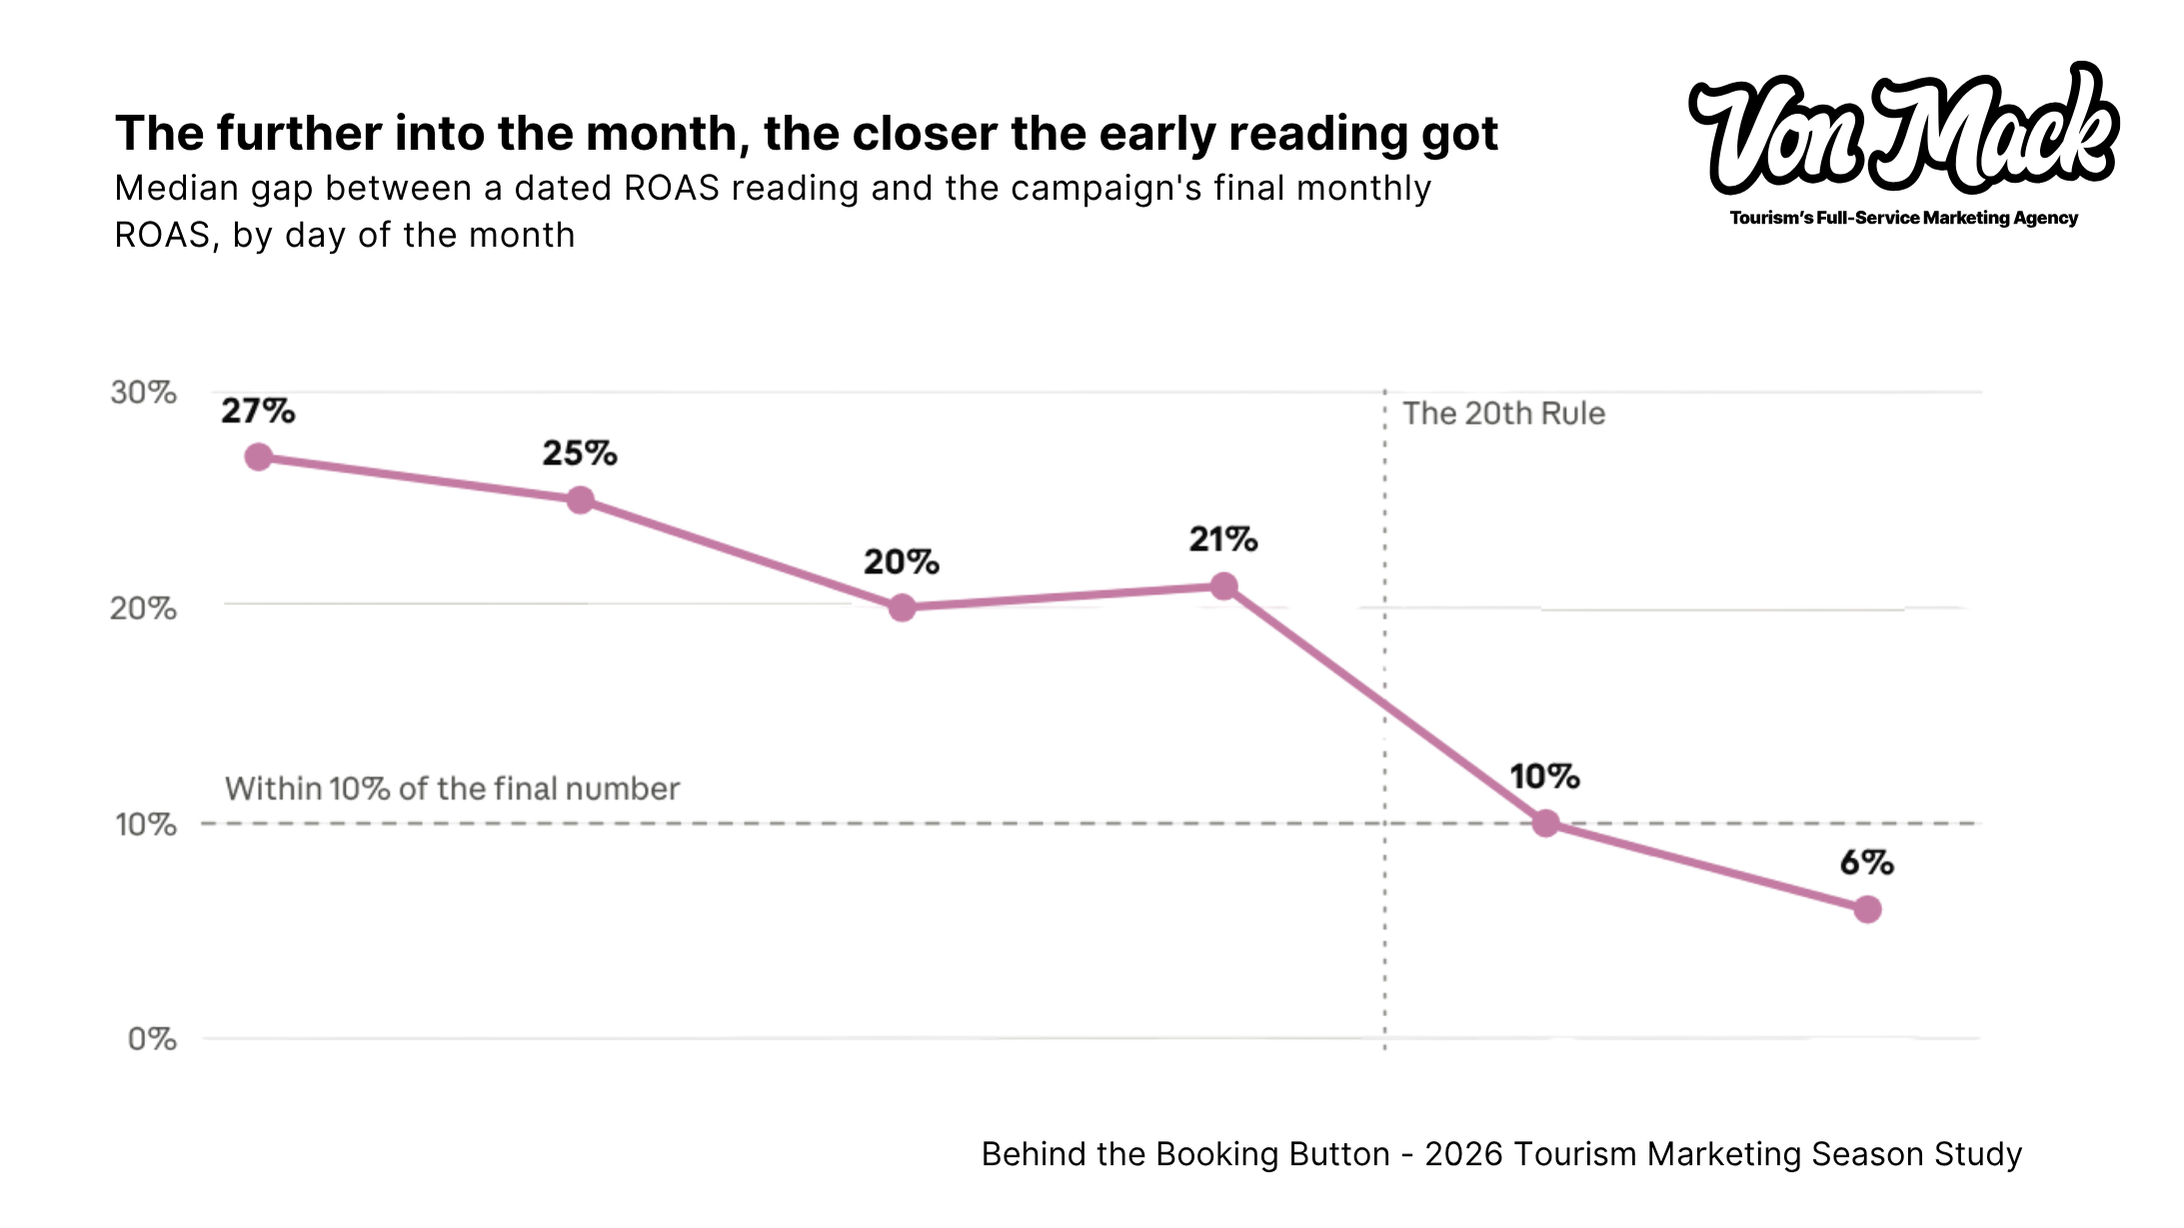
We pulled hundreds of dated ROAS readings from our team’s weekly logs and compared each with its campaign’s final monthly figure. About three in four readings from the first ten days of a month landed more than 10% away from the final number, with a median miss of about 26%. By the last ten days of the month, the median miss had shrunk to about 7%.
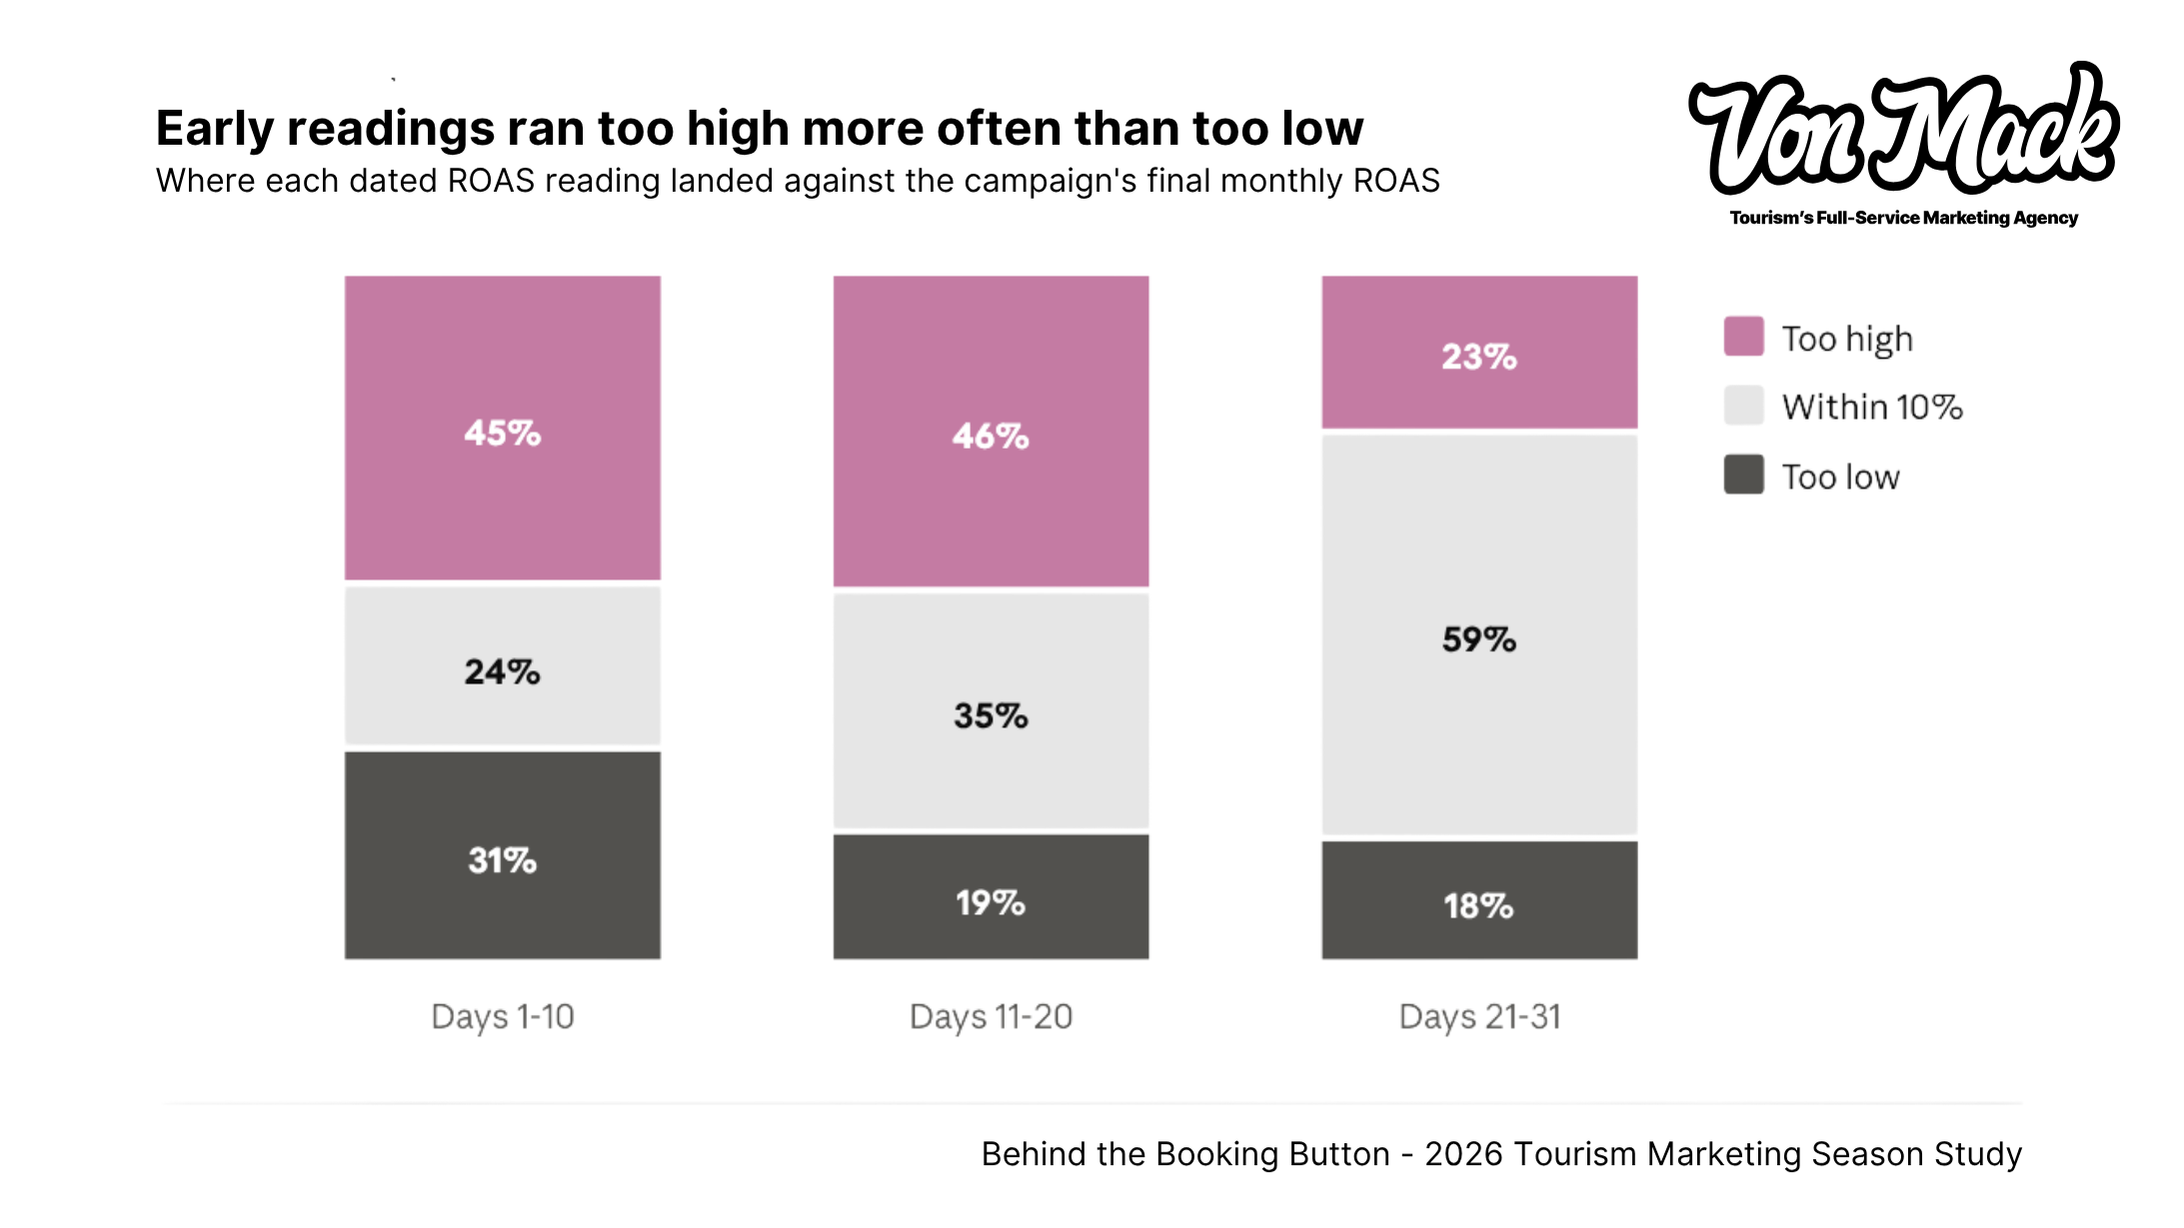
And the early misses went both ways. Early readings actually ran too high more often than too low, because one or two big bookings can make a small early sample look like the campaign just discovered magic.
Psychologists Amos Tversky and Daniel Kahneman named this trap the “belief in the law of small numbers,” warning that it leads people to place undue confidence in early trends. A simple rule of thumb, which we call the 20th Rule: don’t judge a month’s performance before the 20th.
The same caution applies, even more so, to year-over-year comparisons. Changes to tracking, or newly counting actions that were invisible before, are extremely common.
Starting to count phone calls alone can make year-over-year revenue look several times larger than it really grew. Account for tracking changes right alongside shifts in travel behavior and markets as you plan ahead.
And guess what? Each platform grades its own homework! Of course they do.
As expected, Meta’s default reporting credits an ad for a purchase made within seven days of a click, or within one day of simply seeing the ad, even if the guest never clicked. Google counts by its own rules too, so the same booking can be claimed by more than one platform.
That’s why we judge channels together rather than crowning one winner, which is also at the heart of how we decide where tourism clients spend their marketing dollars. So just keep in mind that better measurement does not automatically mean more guests arrived.
In the logbook: Our team recorded hundreds of dated ROAS readings this season. Lined up against each month’s final numbers, they became this finding.
How We Did This
The logbook. Our account managers keep dated, weekly notes on every campaign they run: what they saw, what they changed, and what clients told them. From mid-June through mid-October 2026, that logbook grew to about 1,000 dated entries (each account’s log counted separately). We tagged each entry by topic using whole-word keyword matching (budgets, holidays, weather, phone calls, competition, tracking, and more) and measured the share of accounts whose notes mentioned each topic, week by week. Keyword tagging can miss nuance, so treat those percentages as directional.
The campaign data. Von Mack Agency reviewed nearly $1 million in ad spend across our tourism portfolio, including attractions, tours, and travel experiences in U.S. destinations and international outbound travel, on Google Ads, Meta, TikTok, and Reddit, from June through mid-October 2026. Comparisons between months and the phone-call figures use the four complete months, June through September. “Revenue” means the purchase value each ad platform attributed to its ads; “bookings” means platform-attributed purchases. Some comparisons use only the accounts with comparable data, such as matching channels or call tracking.
Account performance. Across the portfolio, platform-attributed revenue returned about 5.1x ad spend from June through mid-October 2026, and at least 4.7x in every month. These findings describe what happens behind healthy campaigns, not a rescue mission.
Privacy. Every figure is aggregated across the portfolio. No individual client, location, product, or campaign is identified. These are Von Mack client accounts, not a representative sample of the tourism industry.
What this Means for Tourism Marketers
Tourism is not e-commerce with palm trees. A guest has to feel an experience before they buy it, fit it into a real day, and often talk it through with someone, sometimes a real person on the phone. Ad reports were built to count clicks and purchases. They were never built to see a family’s half-day, a sale that closed on a call, or a budget cut made in an August panic.
That doesn’t make the reports wrong. It makes them incomplete, and the gaps get expensive when decisions run on the report alone: cutting spend that was working, assuming the off-season is cheaper when each booking costs more, or calling a month a win (or a loss) before the 20th.
So get closer to the numbers, and to the deeper workings of the business behind them. Know what actually sold, what was merely attributed, where a guest needed help, and which conclusions the evidence can’t support yet. And let’s not declare victory or defeat on the ninth of the month because Pixeldust had a good morning.
That’s the work we do at Von Mack. Our digital marketing team puts the numbers next to the booking reality, from the official booking path to the phone, then works out what the next strategic decision actually requires. Tourism is all we do. Moving it forward is why.
Before you buy more traffic or cut another budget, find out where the journey breaks. Request a fit conversation, and tell us what’s happening, what you’ve already tried, and where you think the system is breaking. If we’re not the right team, we’ll tell you.
FAQs
Connect with The Von Mack Agency today.
We’re ready to join you in building travel and tourism marketing that moves with culture, clarity, and purpose.